

16 Reefscape Ecology Within the South Pacific
255
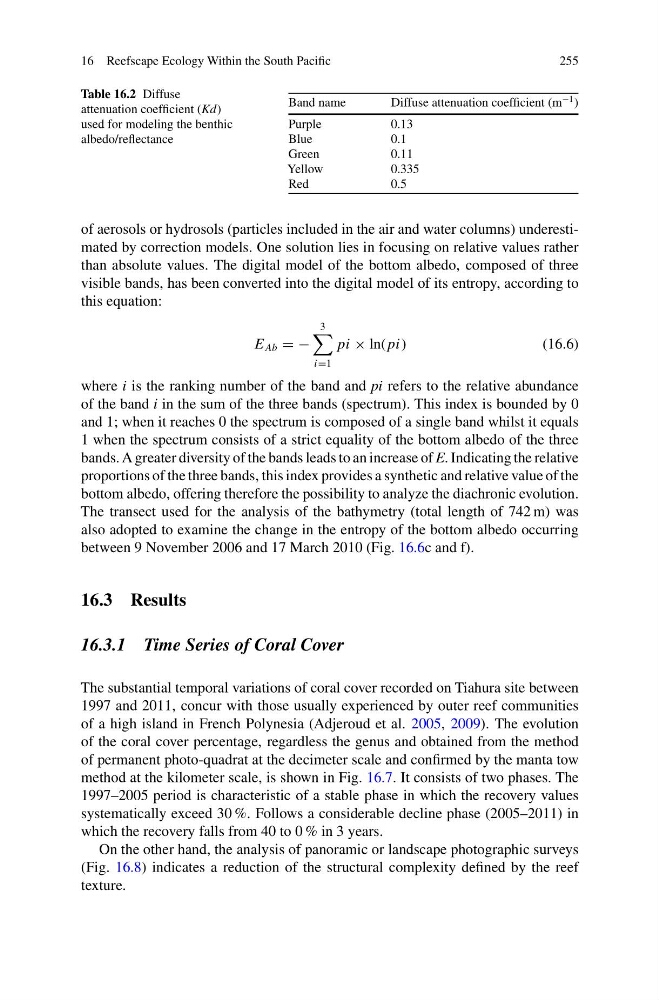
Table 16.2 Diffuse
attenuation coefficient (Kd)
used for modeling the benthic
albedo/reflectance
Band name
Diffuse attenuation coefficient (m
−1 )
Purple
0.13
Blue
0.1
Green
0.11
Yellow
0.335
Red
0.5
of aerosols or hydrosols (particles included in the air and water columns) underestimated by correction models. One solution lies in focusing on relative values rather
than absolute values. The digital model of the bottom albedo, composed of three
visible bands, has been converted into the digital model of its entropy, according to
this equation:
E Ab = −
3
i=1
pi × ln(pi)
(16.6)
where i is the ranking number of the band and pi refers to the relative abundance
of the band i in the sum of the three bands (spectrum). This index is bounded by 0
and 1; when it reaches 0 the spectrum is composed of a single band whilst it equals
1 when the spectrum consists of a strict equality of the bottom albedo of the three
bands. A greater diversity of the bands leads to an increase of E. Indicating the relative
proportions of the three bands, this index provides a synthetic and relative value of the
bottom albedo, offering therefore the possibility to analyze the diachronic evolution.
The transect used for the analysis of the bathymetry (total length of 742 m) was
also adopted to examine the change in the entropy of the bottom albedo occurring
between 9 November 2006 and 17 March 2010 (Fig. 16.6c and f).
16.3 Results
16.3.1 Time Series of Coral Cover
The substantial temporal variations of coral cover recorded on Tiahura site between
1997 and 2011, concur with those usually experienced by outer reef communities
of a high island in French Polynesia (Adjeroud et al. 2005, 2009). The evolution
of the coral cover percentage, regardless the genus and obtained from the method
of permanent photo-quadrat at the decimeter scale and confirmed by the manta tow
method at the kilometer scale, is shown in Fig. 16.7. It consists of two phases. The
1997–2005 period is characteristic of a stable phase in which the recovery values
systematically exceed 30 %. Follows a considerable decline phase (2005–2011) in
which the recovery falls from 40 to 0 % in 3 years.
On the other hand, the analysis of panoramic or landscape photographic surveys
(Fig. 16.8) indicates a reduction of the structural complexity defined by the reef
texture.
255
Table 16.2 Diffuse
attenuation coefficient (Kd)
used for modeling the benthic
albedo/reflectance
Band name
Diffuse attenuation coefficient (m
−1 )
Purple
0.13
Blue
0.1
Green
0.11
Yellow
0.335
Red
0.5
of aerosols or hydrosols (particles included in the air and water columns) underestimated by correction models. One solution lies in focusing on relative values rather
than absolute values. The digital model of the bottom albedo, composed of three
visible bands, has been converted into the digital model of its entropy, according to
this equation:
E Ab = −
3
i=1
pi × ln(pi)
(16.6)
where i is the ranking number of the band and pi refers to the relative abundance
of the band i in the sum of the three bands (spectrum). This index is bounded by 0
and 1; when it reaches 0 the spectrum is composed of a single band whilst it equals
1 when the spectrum consists of a strict equality of the bottom albedo of the three
bands. A greater diversity of the bands leads to an increase of E. Indicating the relative
proportions of the three bands, this index provides a synthetic and relative value of the
bottom albedo, offering therefore the possibility to analyze the diachronic evolution.
The transect used for the analysis of the bathymetry (total length of 742 m) was
also adopted to examine the change in the entropy of the bottom albedo occurring
between 9 November 2006 and 17 March 2010 (Fig. 16.6c and f).
16.3 Results
16.3.1 Time Series of Coral Cover
The substantial temporal variations of coral cover recorded on Tiahura site between
1997 and 2011, concur with those usually experienced by outer reef communities
of a high island in French Polynesia (Adjeroud et al. 2005, 2009). The evolution
of the coral cover percentage, regardless the genus and obtained from the method
of permanent photo-quadrat at the decimeter scale and confirmed by the manta tow
method at the kilometer scale, is shown in Fig. 16.7. It consists of two phases. The
1997–2005 period is characteristic of a stable phase in which the recovery values
systematically exceed 30 %. Follows a considerable decline phase (2005–2011) in
which the recovery falls from 40 to 0 % in 3 years.
On the other hand, the analysis of panoramic or landscape photographic surveys
(Fig. 16.8) indicates a reduction of the structural complexity defined by the reef
texture.