

14 Underwater Multimodal Survey: Merging Optical and Acoustic Data
225
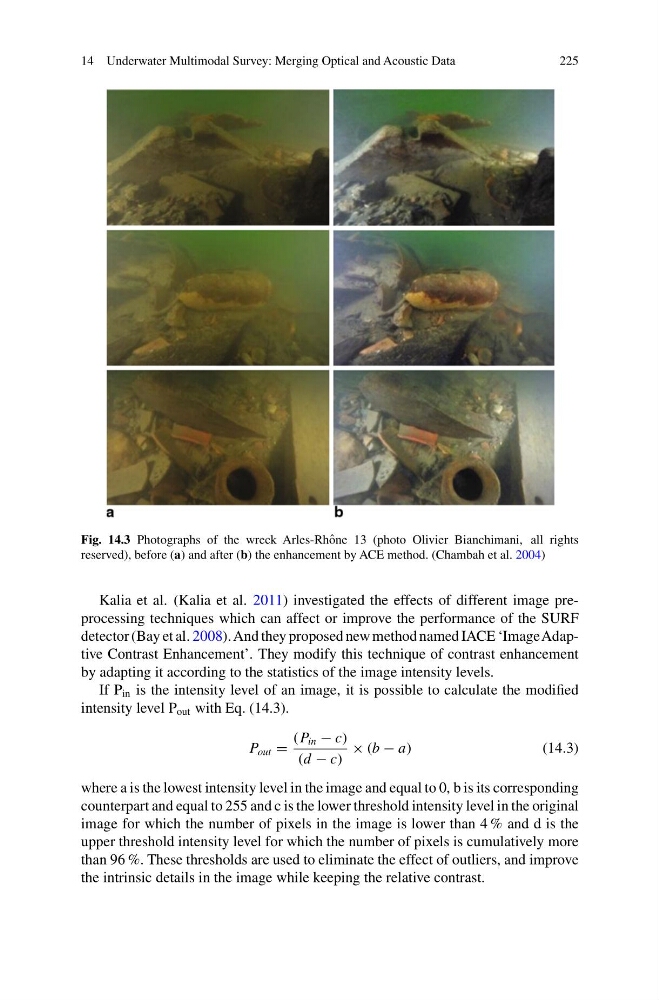
Fig. 14.3 Photographs of the wreck Arles-Rhˆ one 13 (photo Olivier Bianchimani, all rights
reserved), before (a) and after (b) the enhancement by ACE method. (Chambah et al. 2004)
Kalia et al. (Kalia et al. 2011) investigated the effects of different image preprocessing techniques which can affect or improve the performance of the SURF
detector (Bay et al. 2008). And they proposed new method named IACE ‘ImageAdaptive Contrast Enhancement’. They modify this technique of contrast enhancement
by adapting it according to the statistics of the image intensity levels.
If P in is the intensity level of an image, it is possible to calculate the modified
intensity level P out with Eq. (14.3).
P out =
(P in − c)
(d − c)
× (b − a)
(14.3)
where a is the lowest intensity level in the image and equal to 0, b is its corresponding
counterpart and equal to 255 and c is the lower threshold intensity level in the original
image for which the number of pixels in the image is lower than 4 % and d is the
upper threshold intensity level for which the number of pixels is cumulatively more
than 96 %. These thresholds are used to eliminate the effect of outliers, and improve
the intrinsic details in the image while keeping the relative contrast.
225
Fig. 14.3 Photographs of the wreck Arles-Rhˆ one 13 (photo Olivier Bianchimani, all rights
reserved), before (a) and after (b) the enhancement by ACE method. (Chambah et al. 2004)
Kalia et al. (Kalia et al. 2011) investigated the effects of different image preprocessing techniques which can affect or improve the performance of the SURF
detector (Bay et al. 2008). And they proposed new method named IACE ‘ImageAdaptive Contrast Enhancement’. They modify this technique of contrast enhancement
by adapting it according to the statistics of the image intensity levels.
If P in is the intensity level of an image, it is possible to calculate the modified
intensity level P out with Eq. (14.3).
P out =
(P in − c)
(d − c)
× (b − a)
(14.3)
where a is the lowest intensity level in the image and equal to 0, b is its corresponding
counterpart and equal to 255 and c is the lower threshold intensity level in the original
image for which the number of pixels in the image is lower than 4 % and d is the
upper threshold intensity level for which the number of pixels is cumulatively more
than 96 %. These thresholds are used to eliminate the effect of outliers, and improve
the intrinsic details in the image while keeping the relative contrast.