

Chapter 26 A Landscape Perspective
627
Table 1. Landscape descriptors used in quantifying landscape elements [modified from Robbins
and Bell (1994) and Gustafson (1998)].
Descriptor
Definition
Complexity
A measure of patch size and shape; an index based on the ratio of
patch perimeter to area
Patch isolation
A measure of the distance between an individual patch and its
nearest neighbors
Contiguity; contagion
A measure of patch aggregation or dispersion; the index is the
inverse of a fragmentation index
Landscape diversity
A measure of the proportion of the landscape exhibiting a given
element type
Landscape dominance
The proportion of an element type compared to all landscape
elements
Fractal dimension (D)
A measure of boundary complexity; the calculated ‘fractional
dimension’ indicates whether a boundary is closer to linear
(D = 1) or approaches the second dimension (D = 2).
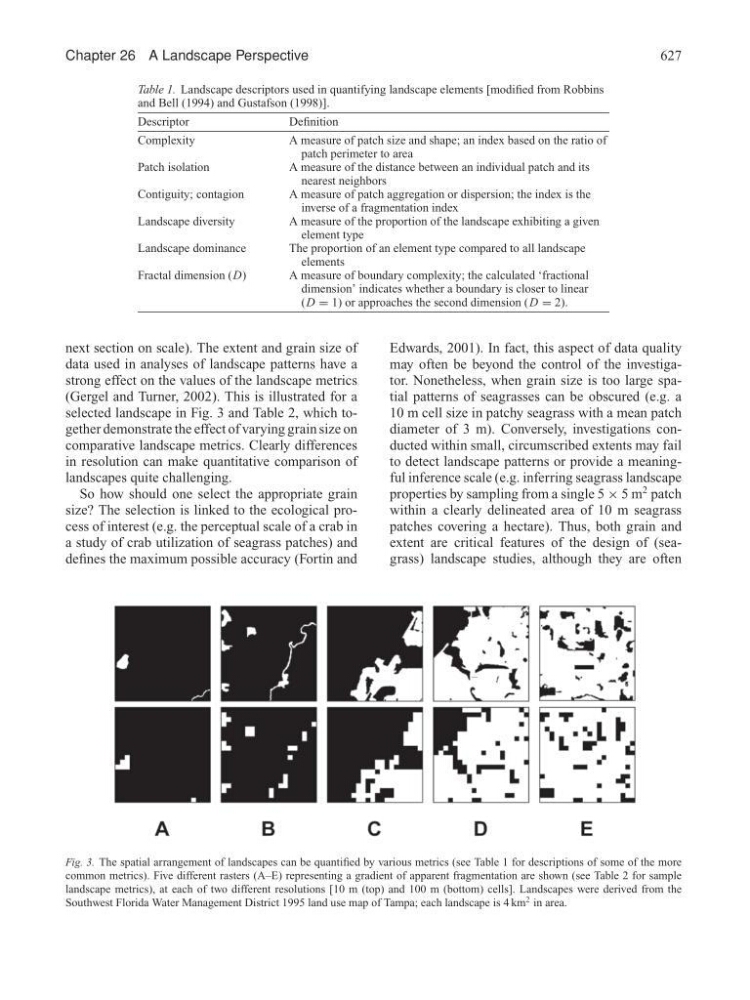
next section on scale). The extent and grain size of
data used in analyses of landscape patterns have a
strong effect on the values of the landscape metrics
(Gergel and Turner, 2002). This is illustrated for a
selected landscape in Fig. 3 and Table 2, which together demonstrate the effect of varying grain size on
comparative landscape metrics. Clearly differences
in resolution can make quantitative comparison of
landscapes quite challenging.
So how should one select the appropriate grain
size? The selection is linked to the ecological process of interest (e.g. the perceptual scale of a crab in
a study of crab utilization of seagrass patches) and
defines the maximum possible accuracy (Fortin and
Edwards, 2001). In fact, this aspect of data quality
may often be beyond the control of the investigator. Nonetheless, when grain size is too large spatial patterns of seagrasses can be obscured (e.g. a
10 m cell size in patchy seagrass with a mean patch
diameter of 3 m). Conversely, investigations conducted within small, circumscribed extents may fail
to detect landscape patterns or provide a meaningful inference scale (e.g. inferring seagrass landscape
properties by sampling from a single 5 × 5 m
2 patch
within a clearly delineated area of 10 m seagrass
patches covering a hectare). Thus, both grain and
extent are critical features of the design of (seagrass) landscape studies, although they are often
Fig. 3. The spatial arrangement of landscapes can be quantified by various metrics (see Table 1 for descriptions of some of the more
common metrics). Five different rasters (A–E) representing a gradient of apparent fragmentation are shown (see Table 2 for sample
landscape metrics), at each of two different resolutions [10 m (top) and 100 m (bottom) cells]. Landscapes were derived from the
Southwest Florida Water Management District 1995 land use map of Tampa; each landscape is 4 km
2 in area.