

554
D. I. Walker, G. A. Kendrick, and A. J. McComb
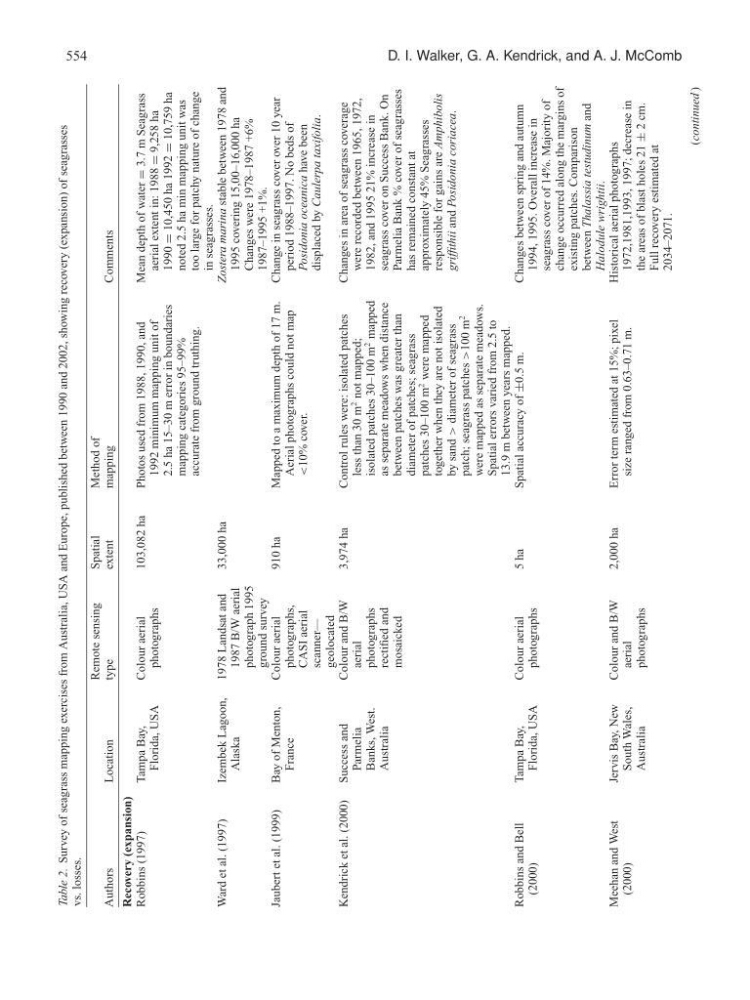
Table 2. Survey of seagrass mapping exercises from Australia, USA and Europe, published between 1990 and 2002, showing recovery (expansion) of seagrasses
vs. losses.
Remote sensing
Spatial
Method of
Authors
Location
type
extent
mapping
Comments
Recovery (expansion)
Robbins (1997)
Tampa Bay,
Florida, USA
Colour aerial
photographs
103,082 ha
Photos used from 1988, 1990, and
1992 minimum mapping unit of
2.5 ha 15–30 m error in boundaries
mapping categories 95–99%
accurate from ground truthing.
Mean depth of water
= 3.7 m Seagrass
aerial extent in: 1988
= 9,258 ha
1990
= 10,450 ha 1992
= 10,759 ha
noted 2.5 ha min mapping unit was
too large for patchy nature of change
in seagrasses.
Ward et al. (1997)
Izembek Lagoon,
Alaska
1978 Landsat and
1987 B/W aerial
photograph 1995
ground survey
33,000 ha
Zostera marina stable between 1978 and
1995 covering 15,00–16,000 ha
Changes were 1978–1987 +6%
1987–1995 +1%.
Jaubert et al. (1999)
Bay of Menton,
France
Colour aerial
photographs,
CASI aerial
scanner—
geolocated
910 ha
Mapped to a maximum depth of 17 m.
Aerial photographs could not map
<10% cover.
Change in seagrass cover over 10 year
period 1988–1997. No beds of
Posidonia oceanica have been
displaced by Caulerpa taxifolia.
Kendrick et al. (2000) Success and
Parmelia
Banks, West.
Australia
Colour and B/W
aerial
photographs
rectified and
mosaicked
3,974 ha
Control rules were: isolated patches
less than 30 m
2
not mapped;
isolated patches 30–100 m
2
mapped
as separate meadows when distance
between patches was greater than
diameter of patches; seagrass
patches 30–100 m
2
were mapped
together when they are not isolated
by sand
> diameter of seagrass
patch; seagrass patches
>100 m
2
were mapped as separate meadows.
Spatial errors varied from 2.5 to
13.9 m between years mapped.
Changes in area of seagrass coverage
were recorded between 1965, 1972,
1982, and 1995 21% increase in
seagrass cover on Success Bank. On
Parmelia Bank % cover of seagrasses
has remained constant at
approximately 45% Seagrasses
responsible for gains are Amphibolis
griffithii and Posidonia coriacea.
Robbins and Bell
(2000)
Tampa Bay,
Florida, USA
Colour aerial
photographs
5 ha
Spatial accuracy of
±0.5 m.
Changes between spring and autumn
1994, 1995. Overall increase in
seagrass cover of 14%. Majority of
change occurred along the margins of
existing patches. Comparison
between Thalassia testudinum and
Halodule wrightii.
Meehan and West
(2000)
Jervis Bay, New
South Wales,
Australia
Colour and B/W
aerial
photographs
2,000 ha
Error term estimated at 15%; pixel
size ranged from 0.63–0.71 m.
Historical aerial photographs
1972,1981,1993, 1997; decrease in
the areas of blast holes 21
± 2 cm.
Full recovery estimated at
2034–2071.
(continued )
D. I. Walker, G. A. Kendrick, and A. J. McComb
Table 2. Survey of seagrass mapping exercises from Australia, USA and Europe, published between 1990 and 2002, showing recovery (expansion) of seagrasses
vs. losses.
Remote sensing
Spatial
Method of
Authors
Location
type
extent
mapping
Comments
Recovery (expansion)
Robbins (1997)
Tampa Bay,
Florida, USA
Colour aerial
photographs
103,082 ha
Photos used from 1988, 1990, and
1992 minimum mapping unit of
2.5 ha 15–30 m error in boundaries
mapping categories 95–99%
accurate from ground truthing.
Mean depth of water
= 3.7 m Seagrass
aerial extent in: 1988
= 9,258 ha
1990
= 10,450 ha 1992
= 10,759 ha
noted 2.5 ha min mapping unit was
too large for patchy nature of change
in seagrasses.
Ward et al. (1997)
Izembek Lagoon,
Alaska
1978 Landsat and
1987 B/W aerial
photograph 1995
ground survey
33,000 ha
Zostera marina stable between 1978 and
1995 covering 15,00–16,000 ha
Changes were 1978–1987 +6%
1987–1995 +1%.
Jaubert et al. (1999)
Bay of Menton,
France
Colour aerial
photographs,
CASI aerial
scanner—
geolocated
910 ha
Mapped to a maximum depth of 17 m.
Aerial photographs could not map
<10% cover.
Change in seagrass cover over 10 year
period 1988–1997. No beds of
Posidonia oceanica have been
displaced by Caulerpa taxifolia.
Kendrick et al. (2000) Success and
Parmelia
Banks, West.
Australia
Colour and B/W
aerial
photographs
rectified and
mosaicked
3,974 ha
Control rules were: isolated patches
less than 30 m
2
not mapped;
isolated patches 30–100 m
2
mapped
as separate meadows when distance
between patches was greater than
diameter of patches; seagrass
patches 30–100 m
2
were mapped
together when they are not isolated
by sand
> diameter of seagrass
patch; seagrass patches
>100 m
2
were mapped as separate meadows.
Spatial errors varied from 2.5 to
13.9 m between years mapped.
Changes in area of seagrass coverage
were recorded between 1965, 1972,
1982, and 1995 21% increase in
seagrass cover on Success Bank. On
Parmelia Bank % cover of seagrasses
has remained constant at
approximately 45% Seagrasses
responsible for gains are Amphibolis
griffithii and Posidonia coriacea.
Robbins and Bell
(2000)
Tampa Bay,
Florida, USA
Colour aerial
photographs
5 ha
Spatial accuracy of
±0.5 m.
Changes between spring and autumn
1994, 1995. Overall increase in
seagrass cover of 14%. Majority of
change occurred along the margins of
existing patches. Comparison
between Thalassia testudinum and
Halodule wrightii.
Meehan and West
(2000)
Jervis Bay, New
South Wales,
Australia
Colour and B/W
aerial
photographs
2,000 ha
Error term estimated at 15%; pixel
size ranged from 0.63–0.71 m.
Historical aerial photographs
1972,1981,1993, 1997; decrease in
the areas of blast holes 21
± 2 cm.
Full recovery estimated at
2034–2071.
(continued )