

Chapter 23 Decline and Recovery of Seagrasses
555
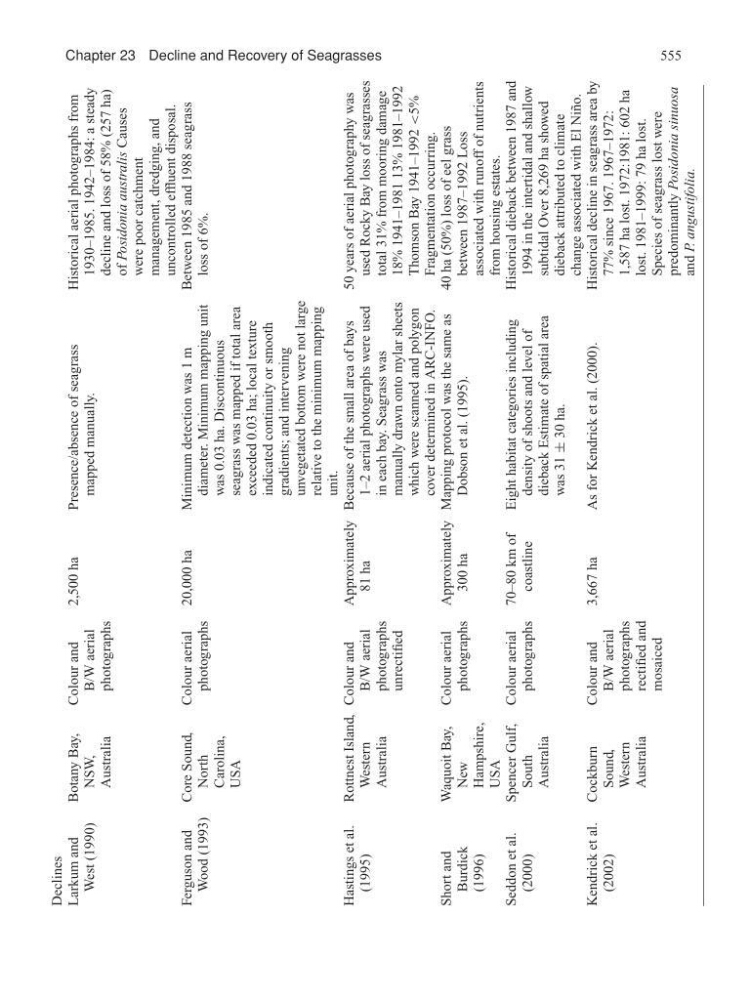
Declines
Larkum and
West (1990)
Botany Bay,
NSW,
Australia
Colour and
B/W aerial
photographs
2,500 ha
Presence/absence of seagrass
mapped manually.
Historical aerial photographs from
1930–1985. 1942–1984: a steady
decline and loss of 58% (257 ha)
of Posidonia australis Causes
were poor catchment
management, dredging, and
uncontrolled effluent disposal.
Ferguson and
Wood (1993)
Core Sound,
North
Carolina,
USA
Colour aerial
photographs
20,000 ha
Minimum detection was 1 m
diameter. Minimum mapping unit
was 0.03 ha. Discontinuous
seagrass was mapped if total area
exceeded 0.03 ha; local texture
indicated continuity or smooth
gradients; and intervening
unvegetated bottom were not large
relative to the minimum mapping
unit.
Between 1985 and 1988 seagrass
loss of 6%.
Hastings et al.
(1995)
Rottnest Island,
Western
Australia
Colour and
B/W aerial
photographs
unrectified
Approximately
81 ha
Because of the small area of bays
1–2 aerial photographs were used
in each bay. Seagrass was
manually drawn onto mylar sheets
which were scanned and polygon
cover determined in ARC-INFO.
50 years of aerial photography was
used Rocky Bay loss of seagrasses
total 31% from mooring damage
18% 1941–1981 13% 1981–1992
Thomson Bay 1941–1992
<5%
Fragmentation occurring.
Short and
Burdick
(1996)
Waquoit Bay,
New
Hampshire,
USA
Colour aerial
photographs
Approximately
300 ha
Mapping protocol was the same as
Dobson et al. (1995).
40 ha (50%) loss of eel grass
between 1987–1992 Loss
associated with runoff of nutrients
from housing estates.
Seddon et al.
(2000)
Spencer Gulf,
South
Australia
Colour aerial
photographs
70–80 km of
coastline
Eight habitat categories including
density of shoots and level of
dieback Estimate of spatial area
was 31
± 30 ha.
Historical dieback between 1987 and
1994 in the intertidal and shallow
subtidal Over 8,269 ha showed
dieback attributed to climate
change associated with El Ni˜ no.
Kendrick et al.
(2002)
Cockburn
Sound,
Western
Australia
Colour and
B/W aerial
photographs
rectified and
mosaiced
3,667 ha
As for Kendrick et al. (2000).
Historical decline in seagrass area by
77% since 1967. 1967–1972:
1,587 ha lost. 1972:1981: 602 ha
lost. 1981–1999: 79 ha lost.
Species of seagrass lost were
predominantly Posidonia sinuosa
and P. angustifolia.
555
Declines
Larkum and
West (1990)
Botany Bay,
NSW,
Australia
Colour and
B/W aerial
photographs
2,500 ha
Presence/absence of seagrass
mapped manually.
Historical aerial photographs from
1930–1985. 1942–1984: a steady
decline and loss of 58% (257 ha)
of Posidonia australis Causes
were poor catchment
management, dredging, and
uncontrolled effluent disposal.
Ferguson and
Wood (1993)
Core Sound,
North
Carolina,
USA
Colour aerial
photographs
20,000 ha
Minimum detection was 1 m
diameter. Minimum mapping unit
was 0.03 ha. Discontinuous
seagrass was mapped if total area
exceeded 0.03 ha; local texture
indicated continuity or smooth
gradients; and intervening
unvegetated bottom were not large
relative to the minimum mapping
unit.
Between 1985 and 1988 seagrass
loss of 6%.
Hastings et al.
(1995)
Rottnest Island,
Western
Australia
Colour and
B/W aerial
photographs
unrectified
Approximately
81 ha
Because of the small area of bays
1–2 aerial photographs were used
in each bay. Seagrass was
manually drawn onto mylar sheets
which were scanned and polygon
cover determined in ARC-INFO.
50 years of aerial photography was
used Rocky Bay loss of seagrasses
total 31% from mooring damage
18% 1941–1981 13% 1981–1992
Thomson Bay 1941–1992
<5%
Fragmentation occurring.
Short and
Burdick
(1996)
Waquoit Bay,
New
Hampshire,
USA
Colour aerial
photographs
Approximately
300 ha
Mapping protocol was the same as
Dobson et al. (1995).
40 ha (50%) loss of eel grass
between 1987–1992 Loss
associated with runoff of nutrients
from housing estates.
Seddon et al.
(2000)
Spencer Gulf,
South
Australia
Colour aerial
photographs
70–80 km of
coastline
Eight habitat categories including
density of shoots and level of
dieback Estimate of spatial area
was 31
± 30 ha.
Historical dieback between 1987 and
1994 in the intertidal and shallow
subtidal Over 8,269 ha showed
dieback attributed to climate
change associated with El Ni˜ no.
Kendrick et al.
(2002)
Cockburn
Sound,
Western
Australia
Colour and
B/W aerial
photographs
rectified and
mosaiced
3,667 ha
As for Kendrick et al. (2000).
Historical decline in seagrass area by
77% since 1967. 1967–1972:
1,587 ha lost. 1972:1981: 602 ha
lost. 1981–1999: 79 ha lost.
Species of seagrass lost were
predominantly Posidonia sinuosa
and P. angustifolia.