

Chapter 13 Light and Photosynthesis in Seagrass Meadows
311
[ ¯
µ d (z)] can be approximated by making a few simple, but relatively robust assumptions. Although we
do not know enough about the scattering properties of seagrass leaves to develop more mechanistic radiative transfer models, this lack of detailed
mechanistic understanding is common to most plant
canopy models. Consequently, bulk scattering within
the canopy is often simulated by assuming that scattering is hemispherically isotropic (bi-lambertian)
about the leaf surface (Shultis and Myneni, 1988).
This means that scattering by the leaf canopy will
cause the average cosine for downwelling irradiance
to become increasingly isotropic [i.e., ¯
µ d (z) → 0.5]
in proportion to the horizontally projected leaf area
in each layer through which the light passes. It also
means that the light attenuation coefficient for the
water column [K d (λ, z)] will increase with depth in
proportion to ¯
µ d (Zimmerman, 2003). Mathematically, this effect can be implemented as:
¯
µ d (z) = ¯
µ d (z − 1)
− {[ ¯
µ d (z − 1) − 0.5]l p (z)}
(13)
where the notation (z − 1) refers to the value of ¯
µ d
for light entering layer (z). Upon reaching the sea
floor, a portion of the light is reflected back in the
upward direction. This reflected light is then attenuated by the plant canopy and water column along its
path back to the sea surface in a process symmetrical
to that for downwelling irradiance:
E u (λ, z) = {[E d (λ, z)R d (λ, z + 1)]
+ E u (λ, z + 1)} [1 − R u (λ, z)]
× exp
−a L (λ)t L
l p (z)
¯
µ u
− K u (λ)z
(14)
The total upward irradiance incident on layer
z, {[E d (λ, z) R d (λ, z)] + E u (λ, z + 1)} , represents
the sum of the downward irradiance reflected from,
and the upward irradiance propagated through the
layer (z + 1) below. In reality, the downwelling irradiance incident on layer z also includes some
upwelling light reflected downward by upper layers of the canopy. This two-flow approach, however, ignores the secondary reflection, which is so
low [E u (λ, z) R u (λ, z − 1) < 0.005E d (λ, z)] that
its contribution to E d (λ, z) is extremely difficult to
measure practically, and its contribution to photosynthesis is insignificant.
VI. Irradiance Distributions Within
the Seagrass Canopy
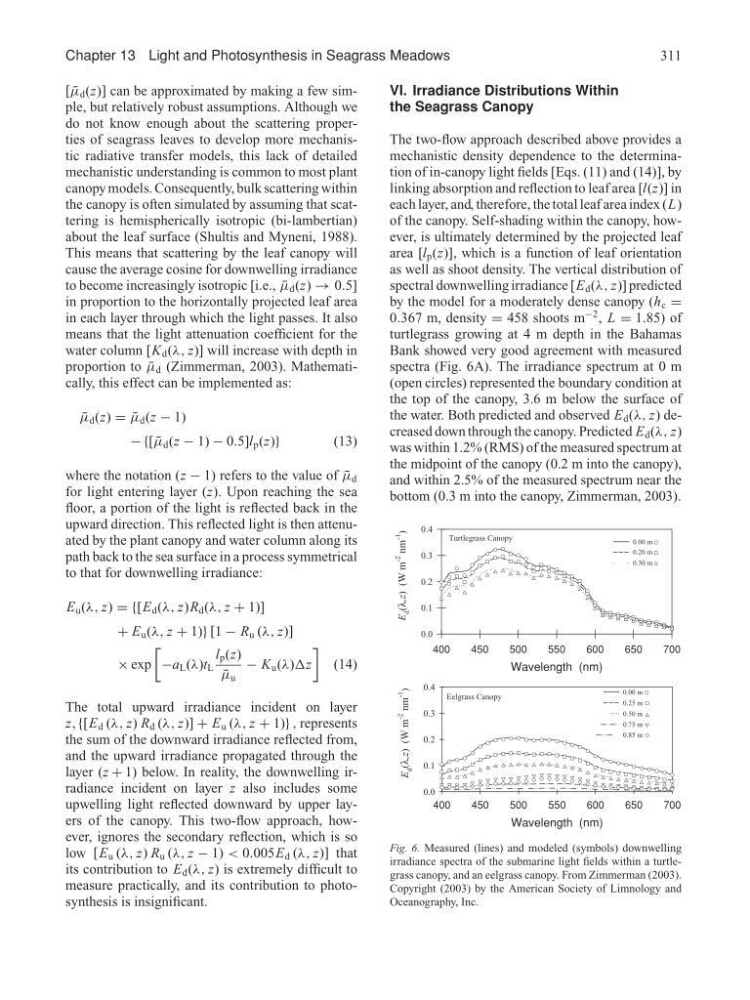
The two-flow approach described above provides a
mechanistic density dependence to the determination of in-canopy light fields [Eqs. (11) and (14)], by
linking absorption and reflection to leaf area [l(z)] in
each layer, and, therefore, the total leaf area index (L)
of the canopy. Self-shading within the canopy, however, is ultimately determined by the projected leaf
area [l p (z)], which is a function of leaf orientation
as well as shoot density. The vertical distribution of
spectral downwelling irradiance [E d (λ, z)] predicted
by the model for a moderately dense canopy (h c =
0.367 m, density = 458 shoots m
−2 , L = 1.85) of
turtlegrass growing at 4 m depth in the Bahamas
Bank showed very good agreement with measured
spectra (Fig. 6A). The irradiance spectrum at 0 m
(open circles) represented the boundary condition at
the top of the canopy, 3.6 m below the surface of
the water. Both predicted and observed E d (λ, z) decreased down through the canopy. Predicted E d (λ, z)
was within 1.2% (RMS) of the measured spectrum at
the midpoint of the canopy (0.2 m into the canopy),
and within 2.5% of the measured spectrum near the
bottom (0.3 m into the canopy, Zimmerman, 2003).
Wavelength (nm)
400
450
500
550
600
650
700
E
d (λ,z) (W m
-2
nm
-1
)
0.0
0.1
0.2
0.3
0.4
0.00 m
0.20 m
0.30 m
Wavelength (nm)
400
450
500
550
600
650
700
E
d (λ,z) (W m
-2
nm
-1
)
0.0
0.1
0.2
0.3
0.4
0.00 m
0.25 m
0.50 m
0.75 m
0.85 m
Turtlegrass Canopy
Eelgrass Canopy
Fig. 6. Measured (lines) and modeled (symbols) downwelling
irradiance spectra of the submarine light fields within a turtlegrass canopy, and an eelgrass canopy. From Zimmerman (2003).
Copyright (2003) by the American Society of Limnology and
Oceanography, Inc.
311
[ ¯
µ d (z)] can be approximated by making a few simple, but relatively robust assumptions. Although we
do not know enough about the scattering properties of seagrass leaves to develop more mechanistic radiative transfer models, this lack of detailed
mechanistic understanding is common to most plant
canopy models. Consequently, bulk scattering within
the canopy is often simulated by assuming that scattering is hemispherically isotropic (bi-lambertian)
about the leaf surface (Shultis and Myneni, 1988).
This means that scattering by the leaf canopy will
cause the average cosine for downwelling irradiance
to become increasingly isotropic [i.e., ¯
µ d (z) → 0.5]
in proportion to the horizontally projected leaf area
in each layer through which the light passes. It also
means that the light attenuation coefficient for the
water column [K d (λ, z)] will increase with depth in
proportion to ¯
µ d (Zimmerman, 2003). Mathematically, this effect can be implemented as:
¯
µ d (z) = ¯
µ d (z − 1)
− {[ ¯
µ d (z − 1) − 0.5]l p (z)}
(13)
where the notation (z − 1) refers to the value of ¯
µ d
for light entering layer (z). Upon reaching the sea
floor, a portion of the light is reflected back in the
upward direction. This reflected light is then attenuated by the plant canopy and water column along its
path back to the sea surface in a process symmetrical
to that for downwelling irradiance:
E u (λ, z) = {[E d (λ, z)R d (λ, z + 1)]
+ E u (λ, z + 1)} [1 − R u (λ, z)]
× exp
−a L (λ)t L
l p (z)
¯
µ u
− K u (λ)z
(14)
The total upward irradiance incident on layer
z, {[E d (λ, z) R d (λ, z)] + E u (λ, z + 1)} , represents
the sum of the downward irradiance reflected from,
and the upward irradiance propagated through the
layer (z + 1) below. In reality, the downwelling irradiance incident on layer z also includes some
upwelling light reflected downward by upper layers of the canopy. This two-flow approach, however, ignores the secondary reflection, which is so
low [E u (λ, z) R u (λ, z − 1) < 0.005E d (λ, z)] that
its contribution to E d (λ, z) is extremely difficult to
measure practically, and its contribution to photosynthesis is insignificant.
VI. Irradiance Distributions Within
the Seagrass Canopy
The two-flow approach described above provides a
mechanistic density dependence to the determination of in-canopy light fields [Eqs. (11) and (14)], by
linking absorption and reflection to leaf area [l(z)] in
each layer, and, therefore, the total leaf area index (L)
of the canopy. Self-shading within the canopy, however, is ultimately determined by the projected leaf
area [l p (z)], which is a function of leaf orientation
as well as shoot density. The vertical distribution of
spectral downwelling irradiance [E d (λ, z)] predicted
by the model for a moderately dense canopy (h c =
0.367 m, density = 458 shoots m
−2 , L = 1.85) of
turtlegrass growing at 4 m depth in the Bahamas
Bank showed very good agreement with measured
spectra (Fig. 6A). The irradiance spectrum at 0 m
(open circles) represented the boundary condition at
the top of the canopy, 3.6 m below the surface of
the water. Both predicted and observed E d (λ, z) decreased down through the canopy. Predicted E d (λ, z)
was within 1.2% (RMS) of the measured spectrum at
the midpoint of the canopy (0.2 m into the canopy),
and within 2.5% of the measured spectrum near the
bottom (0.3 m into the canopy, Zimmerman, 2003).
Wavelength (nm)
400
450
500
550
600
650
700
E
d (λ,z) (W m
-2
nm
-1
)
0.0
0.1
0.2
0.3
0.4
0.00 m
0.20 m
0.30 m
Wavelength (nm)
400
450
500
550
600
650
700
E
d (λ,z) (W m
-2
nm
-1
)
0.0
0.1
0.2
0.3
0.4
0.00 m
0.25 m
0.50 m
0.75 m
0.85 m
Turtlegrass Canopy
Eelgrass Canopy
Fig. 6. Measured (lines) and modeled (symbols) downwelling
irradiance spectra of the submarine light fields within a turtlegrass canopy, and an eelgrass canopy. From Zimmerman (2003).
Copyright (2003) by the American Society of Limnology and
Oceanography, Inc.