

Chapter 10 Oxygen Movement in Seagrasses
259
0
50
100
150
Distance to root surface (µm)
0
5
10
15
20
25
pO
2 , porewater (kPa)
Root surface
Steady state in light
Steady state in darkness
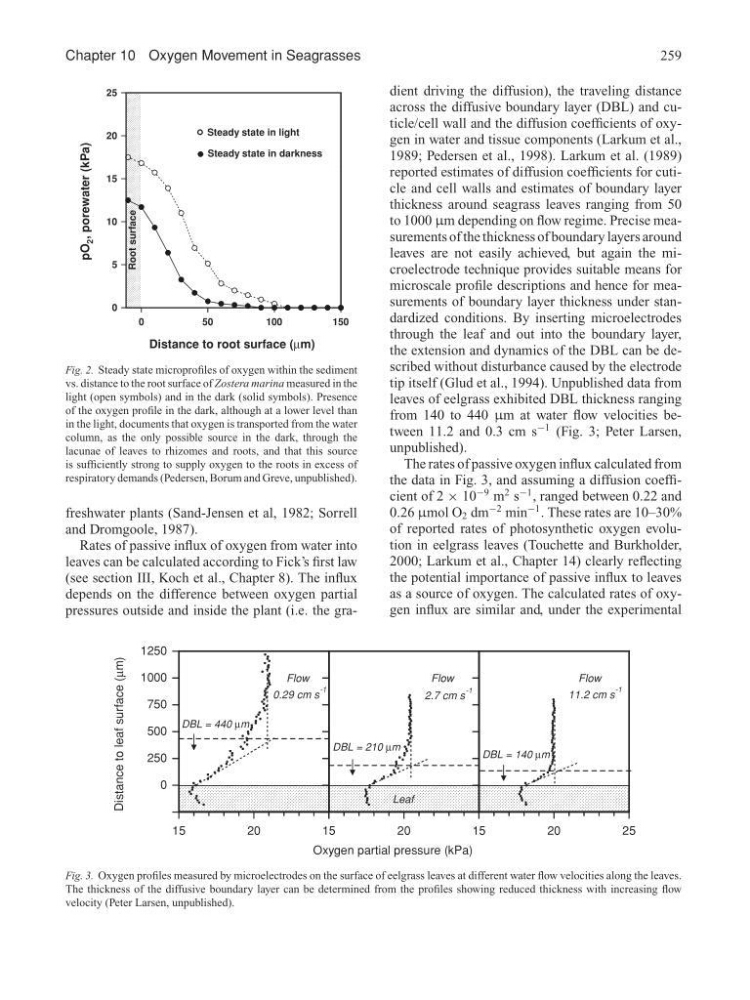
Fig. 2. Steady state microprofiles of oxygen within the sediment
vs. distance to the root surface of Zostera marina measured in the
light (open symbols) and in the dark (solid symbols). Presence
of the oxygen profile in the dark, although at a lower level than
in the light, documents that oxygen is transported from the water
column, as the only possible source in the dark, through the
lacunae of leaves to rhizomes and roots, and that this source
is sufficiently strong to supply oxygen to the roots in excess of
respiratory demands (Pedersen, Borum and Greve, unpublished).
freshwater plants (Sand-Jensen et al, 1982; Sorrell
and Dromgoole, 1987).
Rates of passive influx of oxygen from water into
leaves can be calculated according to Fick’s first law
(see section III, Koch et al., Chapter 8). The influx
depends on the difference between oxygen partial
pressures outside and inside the plant (i.e. the gra15
20
0
250
500
750
1000
1250
15
20
Distance to leaf surface (µm)
15
20
25
Oxygen partial pressure (kPa)
0.29 cm s
-1
2.7 cm s
-1
11.2 cm s
-1
Flow
Flow
Flow
DBL = 440 µm
DBL = 210 µm
DBL = 140 µm
Leaf
Fig. 3. Oxygen profiles measured by microelectrodes on the surface of eelgrass leaves at different water flow velocities along the leaves.
The thickness of the diffusive boundary layer can be determined from the profiles showing reduced thickness with increasing flow
velocity (Peter Larsen, unpublished).
dient driving the diffusion), the traveling distance
across the diffusive boundary layer (DBL) and cuticle/cell wall and the diffusion coefficients of oxygen in water and tissue components (Larkum et al.,
1989; Pedersen et al., 1998). Larkum et al. (1989)
reported estimates of diffusion coefficients for cuticle and cell walls and estimates of boundary layer
thickness around seagrass leaves ranging from 50
to 1000 µm depending on flow regime. Precise measurements of the thickness of boundary layers around
leaves are not easily achieved, but again the microelectrode technique provides suitable means for
microscale profile descriptions and hence for measurements of boundary layer thickness under standardized conditions. By inserting microelectrodes
through the leaf and out into the boundary layer,
the extension and dynamics of the DBL can be described without disturbance caused by the electrode
tip itself (Glud et al., 1994). Unpublished data from
leaves of eelgrass exhibited DBL thickness ranging
from 140 to 440 µm at water flow velocities between 11.2 and 0.3 cm s
−1 (Fig. 3; Peter Larsen,
unpublished).
The rates of passive oxygen influx calculated from
the data in Fig. 3, and assuming a diffusion coefficient of 2 × 10
−9 m
2 s
−1 , ranged between 0.22 and
0.26 µmol O 2 dm
−2 min
−1 . These rates are 10–30%
of reported rates of photosynthetic oxygen evolution in eelgrass leaves (Touchette and Burkholder,
2000; Larkum et al., Chapter 14) clearly reflecting
the potential importance of passive influx to leaves
as a source of oxygen. The calculated rates of oxygen influx are similar and, under the experimental
259
0
50
100
150
Distance to root surface (µm)
0
5
10
15
20
25
pO
2 , porewater (kPa)
Root surface
Steady state in light
Steady state in darkness
Fig. 2. Steady state microprofiles of oxygen within the sediment
vs. distance to the root surface of Zostera marina measured in the
light (open symbols) and in the dark (solid symbols). Presence
of the oxygen profile in the dark, although at a lower level than
in the light, documents that oxygen is transported from the water
column, as the only possible source in the dark, through the
lacunae of leaves to rhizomes and roots, and that this source
is sufficiently strong to supply oxygen to the roots in excess of
respiratory demands (Pedersen, Borum and Greve, unpublished).
freshwater plants (Sand-Jensen et al, 1982; Sorrell
and Dromgoole, 1987).
Rates of passive influx of oxygen from water into
leaves can be calculated according to Fick’s first law
(see section III, Koch et al., Chapter 8). The influx
depends on the difference between oxygen partial
pressures outside and inside the plant (i.e. the gra15
20
0
250
500
750
1000
1250
15
20
Distance to leaf surface (µm)
15
20
25
Oxygen partial pressure (kPa)
0.29 cm s
-1
2.7 cm s
-1
11.2 cm s
-1
Flow
Flow
Flow
DBL = 440 µm
DBL = 210 µm
DBL = 140 µm
Leaf
Fig. 3. Oxygen profiles measured by microelectrodes on the surface of eelgrass leaves at different water flow velocities along the leaves.
The thickness of the diffusive boundary layer can be determined from the profiles showing reduced thickness with increasing flow
velocity (Peter Larsen, unpublished).
dient driving the diffusion), the traveling distance
across the diffusive boundary layer (DBL) and cuticle/cell wall and the diffusion coefficients of oxygen in water and tissue components (Larkum et al.,
1989; Pedersen et al., 1998). Larkum et al. (1989)
reported estimates of diffusion coefficients for cuticle and cell walls and estimates of boundary layer
thickness around seagrass leaves ranging from 50
to 1000 µm depending on flow regime. Precise measurements of the thickness of boundary layers around
leaves are not easily achieved, but again the microelectrode technique provides suitable means for
microscale profile descriptions and hence for measurements of boundary layer thickness under standardized conditions. By inserting microelectrodes
through the leaf and out into the boundary layer,
the extension and dynamics of the DBL can be described without disturbance caused by the electrode
tip itself (Glud et al., 1994). Unpublished data from
leaves of eelgrass exhibited DBL thickness ranging
from 140 to 440 µm at water flow velocities between 11.2 and 0.3 cm s
−1 (Fig. 3; Peter Larsen,
unpublished).
The rates of passive oxygen influx calculated from
the data in Fig. 3, and assuming a diffusion coefficient of 2 × 10
−9 m
2 s
−1 , ranged between 0.22 and
0.26 µmol O 2 dm
−2 min
−1 . These rates are 10–30%
of reported rates of photosynthetic oxygen evolution in eelgrass leaves (Touchette and Burkholder,
2000; Larkum et al., Chapter 14) clearly reflecting
the potential importance of passive influx to leaves
as a source of oxygen. The calculated rates of oxygen influx are similar and, under the experimental