

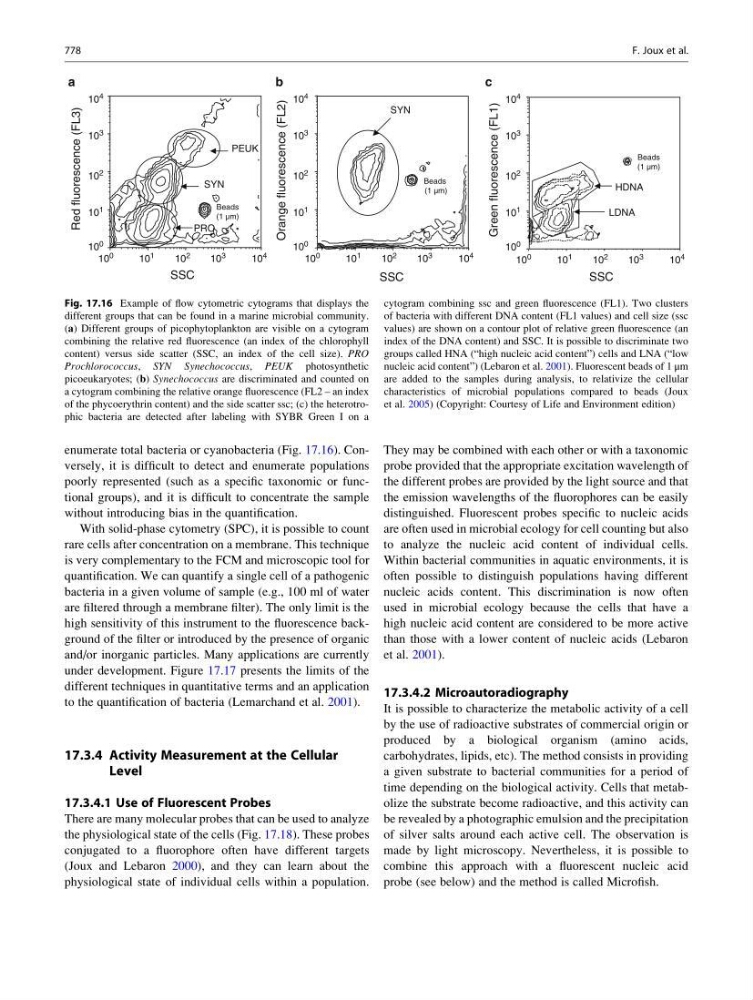
enumerate total bacteria or cyanobacteria (Fig. 17.16). Conversely, it is difficult to detect and enumerate populations
poorly represented (such as a specific taxonomic or functional groups), and it is difficult to concentrate the sample
without introducing bias in the quantification.
With solid-phase cytometry (SPC), it is possible to count
rare cells after concentration on a membrane. This technique
is very complementary to the FCM and microscopic tool for
quantification. We can quantify a single cell of a pathogenic
bacteria in a given volume of sample (e.g., 100 ml of water
are filtered through a membrane filter). The only limit is the
high sensitivity of this instrument to the fluorescence background of the filter or introduced by the presence of organic
and/or inorganic particles. Many applications are currently
under development. Figure 17.17 presents the limits of the
different techniques in quantitative terms and an application
to the quantification of bacteria (Lemarchand et al. 2001).
17.3.4 Activity Measurement at the Cellular
Level
17.3.4.1 Use of Fluorescent Probes
There are many molecular probes that can be used to analyze
the physiological state of the cells (Fig. 17.18). These probes
conjugated to a fluorophore often have different targets
(Joux and Lebaron 2000), and they can learn about the
physiological state of individual cells within a population.
They may be combined with each other or with a taxonomic
probe provided that the appropriate excitation wavelength of
the different probes are provided by the light source and that
the emission wavelengths of the fluorophores can be easily
distinguished. Fluorescent probes specific to nucleic acids
are often used in microbial ecology for cell counting but also
to analyze the nucleic acid content of individual cells.
Within bacterial communities in aquatic environments, it is
often possible to distinguish populations having different
nucleic acids content. This discrimination is now often
used in microbial ecology because the cells that have a
high nucleic acid content are considered to be more active
than those with a lower content of nucleic acids (Lebaron
et al. 2001).
17.3.4.2 Microautoradiography
It is possible to characterize the metabolic activity of a cell
by the use of radioactive substrates of commercial origin or
produced by a biological organism (amino acids,
carbohydrates, lipids, etc). The method consists in providing
a given substrate to bacterial communities for a period of
time depending on the biological activity. Cells that metabolize the substrate become radioactive, and this activity can
be revealed by a photographic emulsion and the precipitation
of silver salts around each active cell. The observation is
made by light microscopy. Nevertheless, it is possible to
combine this approach with a fluorescent nucleic acid
probe (see below) and the method is called Microfish.
Orange fluorescence (FL2)
PRO
SYN
SSC
Red fluorescence (FL3)
Beads
(1 μm)
a
1
PEUK
SSC
b
Beads
(1 μm)
SYN
Green fluorescence (FL1)
Beads
(1 μm)
SSC
LDNA
HDNA
c
10
0
10
1
10
2
10
3
10
4
10
0
10
1
10
2
10
3
10
4
10
0
10
1
10
2
10
3
10
4
10
0
10
1
10
2
10
3
10
4
10
0
10 1
10
2
10
3
10
4
10
0
10
1
10
2
10
3
10
4
Fig. 17.16 Example of flow cytometric cytograms that displays the
different groups that can be found in a marine microbial community.
(a) Different groups of picophytoplankton are visible on a cytogram
combining the relative red fluorescence (an index of the chlorophyll
content) versus side scatter (SSC, an index of the cell size). PRO
Prochlorococcus, SYN Synechococcus, PEUK photosynthetic
picoeukaryotes; (b) Synechococcus are discriminated and counted on
a cytogram combining the relative orange fluorescence (FL2 – an index
of the phycoerythrin content) and the side scatter ssc; (c) the heterotrophic bacteria are detected after labeling with SYBR Green I on a
cytogram combining ssc and green fluorescence (FL1). Two clusters
of bacteria with different DNA content (FL1 values) and cell size (ssc
values) are shown on a contour plot of relative green fluorescence (an
index of the DNA content) and SSC. It is possible to discriminate two
groups called HNA (“high nucleic acid content”) cells and LNA (“low
nucleic acid content”) (Lebaron et al. 2001). Fluorescent beads of 1 μm
are added to the samples during analysis, to relativize the cellular
characteristics of microbial populations compared to beads (Joux
et al. 2005) (Copyright: Courtesy of Life and Environment edition)
778
F. Joux et al.