

Volume of tap water analyzed
0.1 μl
100 ml 10 ml
1 ml 100 μl
10 μl
1 μl
1.4 x 10
7 1.4 x 10
6 1.4 x 10
5 1.4 x 10
4 1.4 x 10
3 1.4 x 10
2 1.4 x 10
1
1
10
100
1 000
10 000
100 000
1 000 000
Cell number of
labeled E. coli
O157:H7
Total number of non-labeled bacteria
present in the sample
SPC
SPC or FCM
SPC or FCM or EFM
EFM
SPC or EFM
Not tested
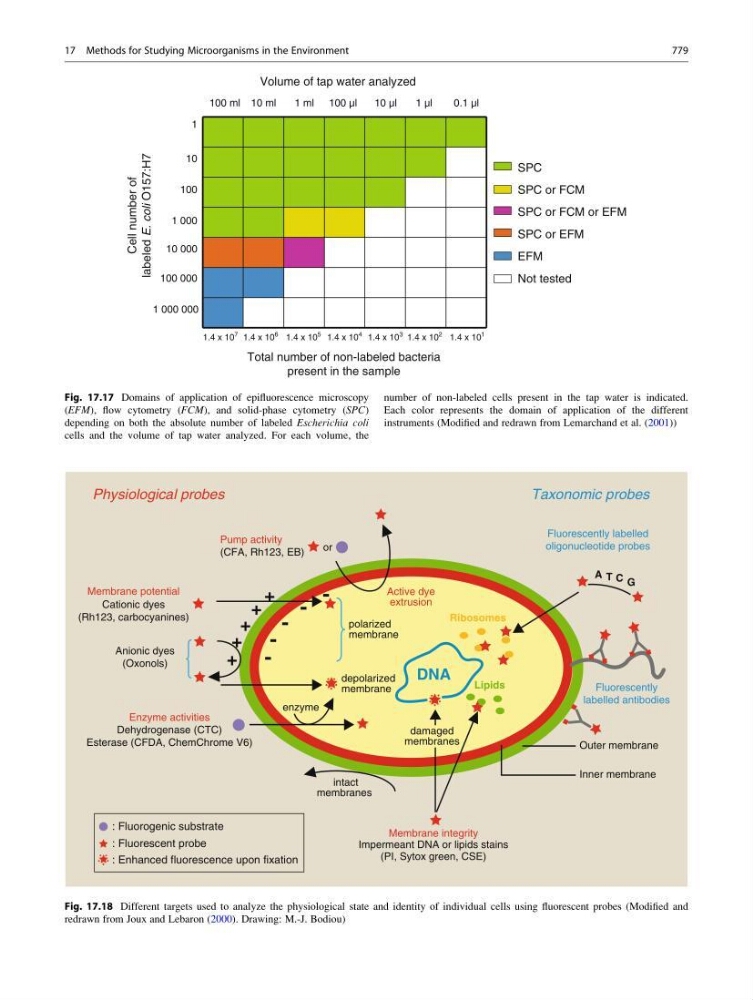
Fig. 17.17 Domains of application of epifluorescence microscopy
(EFM), flow cytometry (FCM), and solid-phase cytometry (SPC)
depending on both the absolute number of labeled Escherichia coli
cells and the volume of tap water analyzed. For each volume, the
number of non-labeled cells present in the tap water is indicated.
Each color represents the domain of application of the different
instruments (Modified and redrawn from Lemarchand et al. (2001))
-
-
-
-
-
+
+
+
+
+
or
Active dye
extrusion
Ribosomes
DNA
Lipids
polarized
membrane
depolarized
membrane
enzyme
intact
membranes
Outer membrane
Inner membrane
damaged
membranes
A T G
C
Pump activity
(CFA, Rh123, EB)
Membrane integrity
Impermeant DNA or lipids stains
(PI, Sytox green, CSE)
Fluorescently labelled
oligonucleotide probes
Fluorescently
labelled antibodies
Taxonomic probes
Physiological probes
Membrane potential
Cationic dyes
(Rh123, carbocyanines)
Enzyme activities
Dehydrogenase (CTC)
Esterase (CFDA, ChemChrome V6)
Anionic dyes
(Oxonols)
: Fluorogenic substrate
: Fluorescent probe
: Enhanced fluorescence upon fixation
Fig. 17.18 Different targets used to analyze the physiological state and identity of individual cells using fluorescent probes (Modified and
redrawn from Joux and Lebaron (2000). Drawing: M.-J. Bodiou)
17 Methods for Studying Microorganisms in the Environment
779