

a
Studied
genomes
b
Gene loss
or
HGT
Studied
genomes
or
Increase of the
evolutionary rate
c
d
O 10 (S 10 )
O 9 (S 9 )
O 8 (S 8 )
O 7 (S 7 )
O 6 (S 6 )
O 5 (S 5 )
O 4 (S 4 )
O 3 (S 3 )
O 2 (S 2 )
O 5 (S 5 )
O 4 (S 4 )
O 3 (S 3 )
O 2 (S 2 )
O 1 (S 1 )
O 10 (S 10 )
O 9 (S 9 )
O 8 (S 8 )
O 7 (S 7 )
O 6 (S 6 )
O 5 (S 5 )
O 4 (S 4 )
O 3 (S 3 )
O 2 (S 2 )
O 1 (S 1 )
O 1 (S 1 )
O 2
O 3
O 4
O 5
O 1 (S 1 )
O 2
O 3
O 4
O 5
O 1 (S 1 )
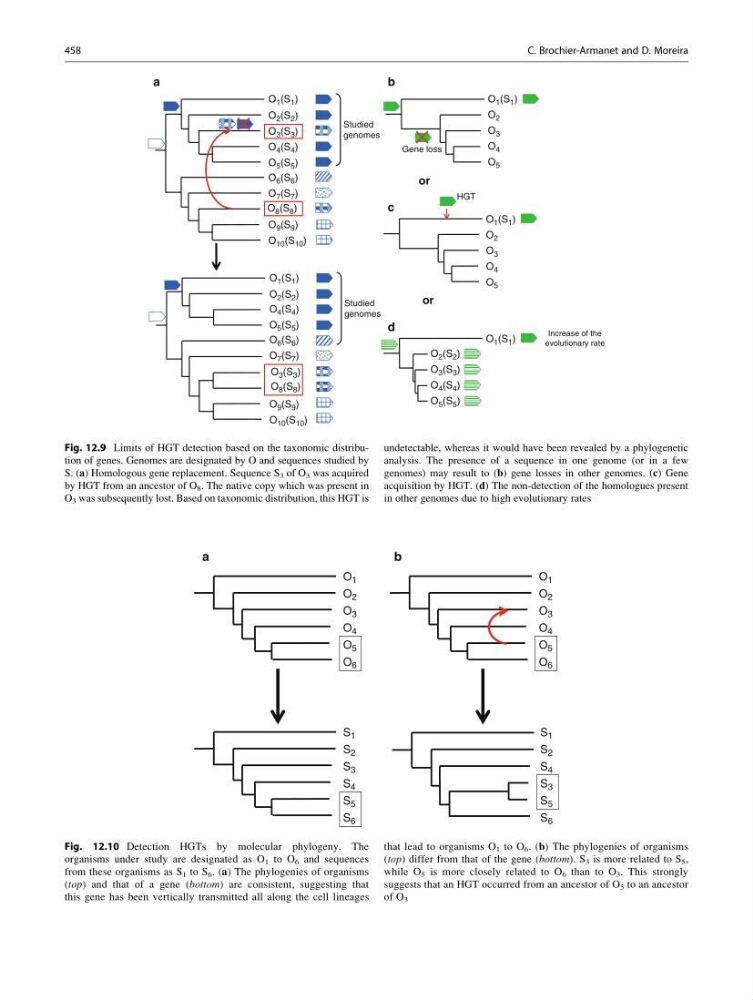
Fig. 12.9 Limits of HGT detection based on the taxonomic distribution of genes. Genomes are designated by O and sequences studied by
S. (a) Homologous gene replacement. Sequence S 3 of O 3 was acquired
by HGT from an ancestor of O 8 . The native copy which was present in
O 3 was subsequently lost. Based on taxonomic distribution, this HGT is
undetectable, whereas it would have been revealed by a phylogenetic
analysis. The presence of a sequence in one genome (or in a few
genomes) may result to (b) gene losses in other genomes. (c) Gene
acquisition by HGT. (d) The non-detection of the homologues present
in other genomes due to high evolutionary rates
O 1
O 2
O 3
O 4
O 5
O 6
a
b
S 1
S 2
S 3
S 4
S 5
S 6
S 1
S 2
S 4
S 3
S 5
S 6
O 1
O 2
O 3
O 4
O 5
O 6
Fig. 12.10 Detection HGTs by molecular phylogeny. The
organisms under study are designated as O 1 to O 6 and sequences
from these organisms as S 1 to S 6 . (a) The phylogenies of organisms
(top) and that of a gene (bottom) are consistent, suggesting that
this gene has been vertically transmitted all along the cell lineages
that lead to organisms O 1 to O 6 . (b) The phylogenies of organisms
(top) differ from that of the gene (bottom). S 3 is more related to S 5 ,
while O 5 is more closely related to O 6 than to O 3 . This strongly
suggests that an HGT occurred from an ancestor of O 5 to an ancestor
of O 3
458
C. Brochier-Armanet and D. Moreira
Studied
genomes
b
Gene loss
or
HGT
Studied
genomes
or
Increase of the
evolutionary rate
c
d
O 10 (S 10 )
O 9 (S 9 )
O 8 (S 8 )
O 7 (S 7 )
O 6 (S 6 )
O 5 (S 5 )
O 4 (S 4 )
O 3 (S 3 )
O 2 (S 2 )
O 5 (S 5 )
O 4 (S 4 )
O 3 (S 3 )
O 2 (S 2 )
O 1 (S 1 )
O 10 (S 10 )
O 9 (S 9 )
O 8 (S 8 )
O 7 (S 7 )
O 6 (S 6 )
O 5 (S 5 )
O 4 (S 4 )
O 3 (S 3 )
O 2 (S 2 )
O 1 (S 1 )
O 1 (S 1 )
O 2
O 3
O 4
O 5
O 1 (S 1 )
O 2
O 3
O 4
O 5
O 1 (S 1 )
Fig. 12.9 Limits of HGT detection based on the taxonomic distribution of genes. Genomes are designated by O and sequences studied by
S. (a) Homologous gene replacement. Sequence S 3 of O 3 was acquired
by HGT from an ancestor of O 8 . The native copy which was present in
O 3 was subsequently lost. Based on taxonomic distribution, this HGT is
undetectable, whereas it would have been revealed by a phylogenetic
analysis. The presence of a sequence in one genome (or in a few
genomes) may result to (b) gene losses in other genomes. (c) Gene
acquisition by HGT. (d) The non-detection of the homologues present
in other genomes due to high evolutionary rates
O 1
O 2
O 3
O 4
O 5
O 6
a
b
S 1
S 2
S 3
S 4
S 5
S 6
S 1
S 2
S 4
S 3
S 5
S 6
O 1
O 2
O 3
O 4
O 5
O 6
Fig. 12.10 Detection HGTs by molecular phylogeny. The
organisms under study are designated as O 1 to O 6 and sequences
from these organisms as S 1 to S 6 . (a) The phylogenies of organisms
(top) and that of a gene (bottom) are consistent, suggesting that
this gene has been vertically transmitted all along the cell lineages
that lead to organisms O 1 to O 6 . (b) The phylogenies of organisms
(top) differ from that of the gene (bottom). S 3 is more related to S 5 ,
while O 5 is more closely related to O 6 than to O 3 . This strongly
suggests that an HGT occurred from an ancestor of O 5 to an ancestor
of O 3
458
C. Brochier-Armanet and D. Moreira