

guarantee that it has not been affected by HGT. Indeed, a
gene inherited from the last common ancestor of a given
lineage may have been replaced in one or several of its
descendants (Fig. 12.9a). This phenomenon is called homologous gene replacement, because the native gene is lost after
the acquisition by HGT of a homologous gene from a distant
relative. Furthermore, the presence of a gene in a single
genome does not imply that it has been systematically
acquired by HGT. Depending on the branching position of
the considered lineage, gene losses and HGT can provide
similar gene taxonomic distributions (Fig. 12.9b, c). Most of
the time, it is difficult to discriminate between hypotheses
involving some HGTs and those involving some losses
because these two kinds of events are relatively frequent in
microorganisms (especially in prokaryotes).
Maximum parsimony and maximum likelihood models
trying to integrate gene loss, gene birth, and HGT events
have been proposed to improve the estimation of HGT rates.
The main difficulties encountered by these models are that
the frequency of each type of events is not known a priori
and must be estimated. To do so, complex statistical models
have been developed (Szollosi et al. 2012).
Finally, another difficulty is linked to the fact that the
absence of a gene in a given genome is difficult to infer with
confidence. Indeed, due to fast evolutionary rates, some
genes cannot be affiliated to a given gene family
(Fig. 12.9d), although they are actually present, leading to
an overestimation of HGT (Zhaxybayeva et al. 2007).
12.3.3 Methods Based on Phylogenetic
Inference
12.3.3.1 Principle
Detection of HGT with phylogenetic methods aims at comparing the evolutionary history of genes and that of the
organisms carrying them. Indeed, at each generation, the
genomic DNA is transmitted vertically (from parents to
descendants) during the cell division process. This implies
that the evolutionary histories and, therefore, the
phylogenies of genes are expected to be similar to that of
organisms carrying these genes (Fig. 12.10a). If the phylogeny of a gene under study differs from that of organisms, this
may indicate that HGTs have occurred during the evolutionary history of the gene (Fig. 12.10b). Detection of HGT
based on phylogenetic methods is more efficient than that
based on sequence similarity or taxonomic distribution. It is
less susceptible to be misled by differences of evolutionary
rates, taxonomic sampling biases, and/or gene losses. Moreover, in contrast with methods based on sequence similarity,
G 1 G 2 G 3 G 5
G 4
a
Genes shared by the 5 genomes
(likely inherited from the last common
ancestor of the group)
(O 2 )
S 1 (O 1 )
S 1 (O 1 )
(O 3 )
(O 4 )
(O 5 )
S 2 (O 2 )
S 2 (O 2 )
(O 1 )
(O 3 )
(O 4 )
(O 5 )
(O 2 )
(O 1 )
S 3 (O 3 )
S 3 (O 3 )
(O 4 )
(O 5 )
(O 2 )
(O 1 )
(O 3 )
S 4 (O 4 )
S 4 (O 4 )
(O 5 )
(O 2 )
(O 1 )
(O 3 )
(O 4 )
S 5 (O 5 )
S 5 (O 5 )
b
Specific genes to each of the 5 genomes
(likely acquired by HGT after the diversification of
the group)
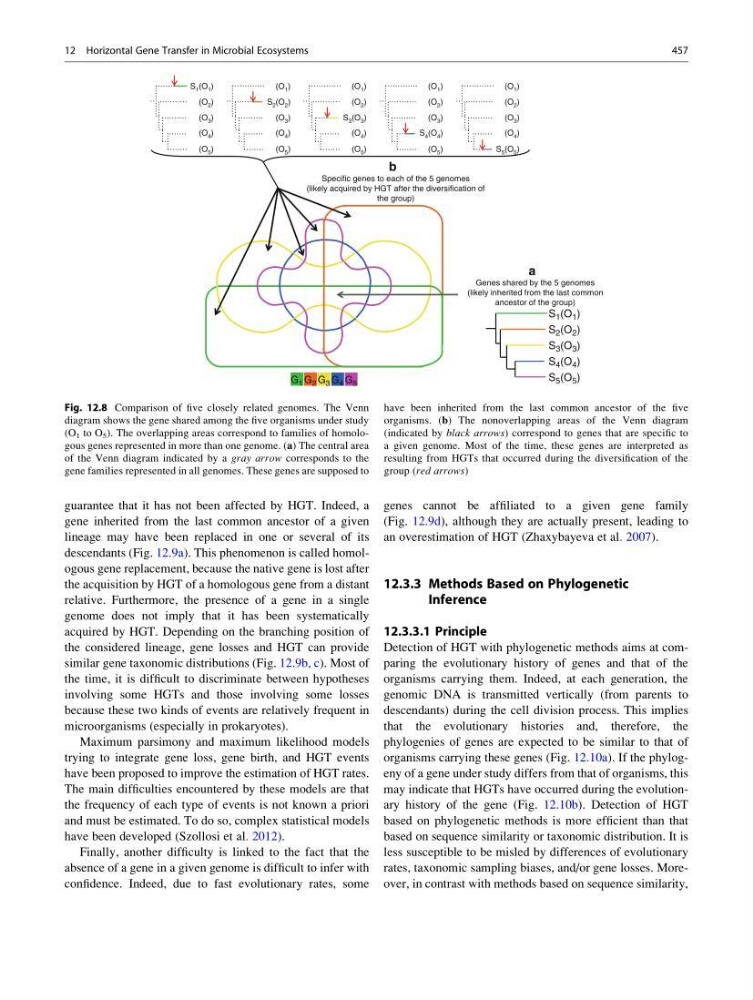
Fig. 12.8 Comparison of five closely related genomes. The Venn
diagram shows the gene shared among the five organisms under study
(O 1 to O 5 ). The overlapping areas correspond to families of homologous genes represented in more than one genome. (a) The central area
of the Venn diagram indicated by a gray arrow corresponds to the
gene families represented in all genomes. These genes are supposed to
have been inherited from the last common ancestor of the five
organisms. (b) The nonoverlapping areas of the Venn diagram
(indicated by black arrows) correspond to genes that are specific to
a given genome. Most of the time, these genes are interpreted as
resulting from HGTs that occurred during the diversification of the
group (red arrows)
12 Horizontal Gene Transfer in Microbial Ecosystems
457
gene inherited from the last common ancestor of a given
lineage may have been replaced in one or several of its
descendants (Fig. 12.9a). This phenomenon is called homologous gene replacement, because the native gene is lost after
the acquisition by HGT of a homologous gene from a distant
relative. Furthermore, the presence of a gene in a single
genome does not imply that it has been systematically
acquired by HGT. Depending on the branching position of
the considered lineage, gene losses and HGT can provide
similar gene taxonomic distributions (Fig. 12.9b, c). Most of
the time, it is difficult to discriminate between hypotheses
involving some HGTs and those involving some losses
because these two kinds of events are relatively frequent in
microorganisms (especially in prokaryotes).
Maximum parsimony and maximum likelihood models
trying to integrate gene loss, gene birth, and HGT events
have been proposed to improve the estimation of HGT rates.
The main difficulties encountered by these models are that
the frequency of each type of events is not known a priori
and must be estimated. To do so, complex statistical models
have been developed (Szollosi et al. 2012).
Finally, another difficulty is linked to the fact that the
absence of a gene in a given genome is difficult to infer with
confidence. Indeed, due to fast evolutionary rates, some
genes cannot be affiliated to a given gene family
(Fig. 12.9d), although they are actually present, leading to
an overestimation of HGT (Zhaxybayeva et al. 2007).
12.3.3 Methods Based on Phylogenetic
Inference
12.3.3.1 Principle
Detection of HGT with phylogenetic methods aims at comparing the evolutionary history of genes and that of the
organisms carrying them. Indeed, at each generation, the
genomic DNA is transmitted vertically (from parents to
descendants) during the cell division process. This implies
that the evolutionary histories and, therefore, the
phylogenies of genes are expected to be similar to that of
organisms carrying these genes (Fig. 12.10a). If the phylogeny of a gene under study differs from that of organisms, this
may indicate that HGTs have occurred during the evolutionary history of the gene (Fig. 12.10b). Detection of HGT
based on phylogenetic methods is more efficient than that
based on sequence similarity or taxonomic distribution. It is
less susceptible to be misled by differences of evolutionary
rates, taxonomic sampling biases, and/or gene losses. Moreover, in contrast with methods based on sequence similarity,
G 1 G 2 G 3 G 5
G 4
a
Genes shared by the 5 genomes
(likely inherited from the last common
ancestor of the group)
(O 2 )
S 1 (O 1 )
S 1 (O 1 )
(O 3 )
(O 4 )
(O 5 )
S 2 (O 2 )
S 2 (O 2 )
(O 1 )
(O 3 )
(O 4 )
(O 5 )
(O 2 )
(O 1 )
S 3 (O 3 )
S 3 (O 3 )
(O 4 )
(O 5 )
(O 2 )
(O 1 )
(O 3 )
S 4 (O 4 )
S 4 (O 4 )
(O 5 )
(O 2 )
(O 1 )
(O 3 )
(O 4 )
S 5 (O 5 )
S 5 (O 5 )
b
Specific genes to each of the 5 genomes
(likely acquired by HGT after the diversification of
the group)
Fig. 12.8 Comparison of five closely related genomes. The Venn
diagram shows the gene shared among the five organisms under study
(O 1 to O 5 ). The overlapping areas correspond to families of homologous genes represented in more than one genome. (a) The central area
of the Venn diagram indicated by a gray arrow corresponds to the
gene families represented in all genomes. These genes are supposed to
have been inherited from the last common ancestor of the five
organisms. (b) The nonoverlapping areas of the Venn diagram
(indicated by black arrows) correspond to genes that are specific to
a given genome. Most of the time, these genes are interpreted as
resulting from HGTs that occurred during the diversification of the
group (red arrows)
12 Horizontal Gene Transfer in Microbial Ecosystems
457