

identifying core genes, i.e., the families of homologous
genes (also called gene repertories) present in the genomes
under study (Fig. 12.8). Together, these genes form the core
genome. In contrast the pangenome is composed of all genes
(i.e., core genes and other genes) present in the genome
under study (cf. Sect. 12.4.1.2). Core genes are supposed to
have been inherited from the last common ancestor of the
organisms and preserved during the evolution of the group
(Fig. 12.8a). In contrast, families represented in only one (or
a few) genome are interpreted as the result of recent
acquisitions via HGT of genes that were absent in the last
common ancestor of the group under study (Fig. 12.8b).
However, HGT is not the only process that can lead to
such gene distribution patterns. They can correspond to
genes of recent origin, namely, which emerged in a specific
genome (or lineage). In this case, no homologue of the
studied gene is expected to be present in other genomes (or
lineages). By contrast, if homologues of the gene are
detected in genomes (or lineages) other than those under
study, the hypothesis of an acquisition through HGT would
be the most likely (Fig. 12.8b).
12.3.2.2 Limits
Although its principle is very simple and intuitive, this
approach may lead to erroneous results. First, the fact that
a gene is common to all members of a group does not
S 2
S 3
S 4 S 5
S 6
S 7
S 8
S 9
S 10
S 11
S 12
S 13
S 14
S 16
S 17
S 18
S 19
S 20
S 21 S 22
S 23
S 24
S 15
S 1
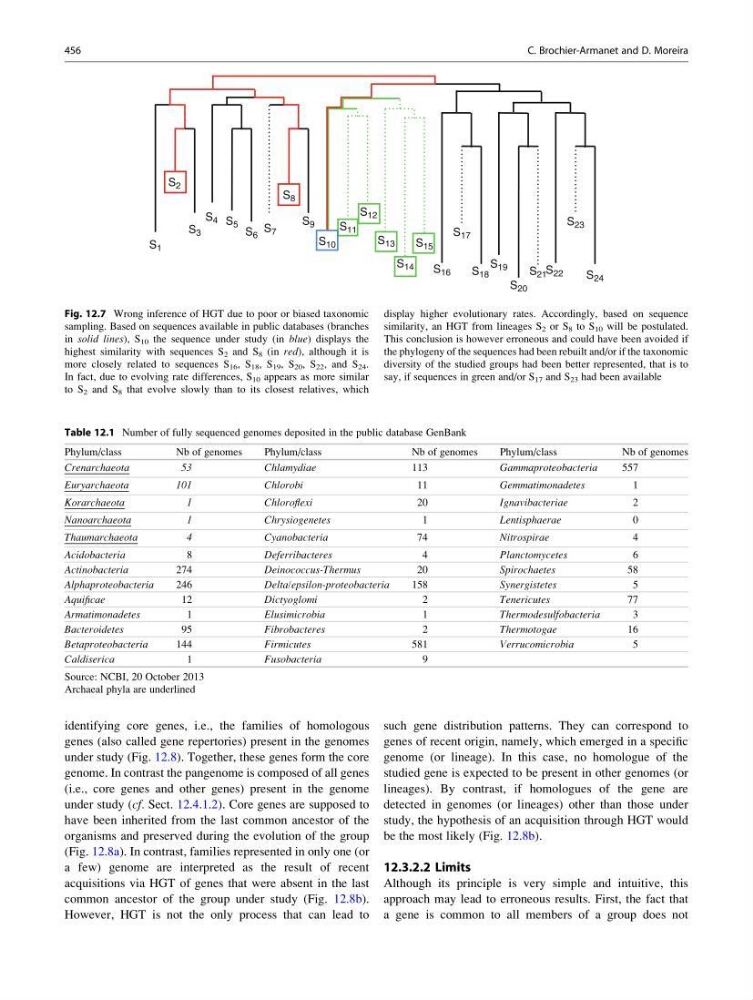
Fig. 12.7 Wrong inference of HGT due to poor or biased taxonomic
sampling. Based on sequences available in public databases (branches
in solid lines), S 10 the sequence under study (in blue) displays the
highest similarity with sequences S 2 and S 8 (in red), although it is
more closely related to sequences S 16 , S 18 , S 19 , S 20 , S 22 , and S 24 .
In fact, due to evolving rate differences, S 10 appears as more similar
to S 2 and S 8 that evolve slowly than to its closest relatives, which
display higher evolutionary rates. Accordingly, based on sequence
similarity, an HGT from lineages S 2 or S 8 to S 10 will be postulated.
This conclusion is however erroneous and could have been avoided if
the phylogeny of the sequences had been rebuilt and/or if the taxonomic
diversity of the studied groups had been better represented, that is to
say, if sequences in green and/or S 17 and S 23 had been available
Table 12.1 Number of fully sequenced genomes deposited in the public database GenBank
Phylum/class
Nb of genomes
Phylum/class
Nb of genomes
Phylum/class
Nb of genomes
Crenarchaeota
53
Chlamydiae
113
Gammaproteobacteria
557
Euryarchaeota
101
Chlorobi
11
Gemmatimonadetes
1
Korarchaeota
1
Chloroflexi
20
Ignavibacteriae
2
Nanoarchaeota
1
Chrysiogenetes
1
Lentisphaerae
0
Thaumarchaeota
4
Cyanobacteria
74
Nitrospirae
4
Acidobacteria
8
Deferribacteres
4
Planctomycetes
6
Actinobacteria
274
Deinococcus-Thermus
20
Spirochaetes
58
Alphaproteobacteria
246
Delta/epsilon-proteobacteria
158
Synergistetes
5
Aquificae
12
Dictyoglomi
2
Tenericutes
77
Armatimonadetes
1
Elusimicrobia
1
Thermodesulfobacteria
3
Bacteroidetes
95
Fibrobacteres
2
Thermotogae
16
Betaproteobacteria
144
Firmicutes
581
Verrucomicrobia
5
Caldiserica
1
Fusobacteria
9
Source: NCBI, 20 October 2013
Archaeal phyla are underlined
456
C. Brochier-Armanet and D. Moreira
genes (also called gene repertories) present in the genomes
under study (Fig. 12.8). Together, these genes form the core
genome. In contrast the pangenome is composed of all genes
(i.e., core genes and other genes) present in the genome
under study (cf. Sect. 12.4.1.2). Core genes are supposed to
have been inherited from the last common ancestor of the
organisms and preserved during the evolution of the group
(Fig. 12.8a). In contrast, families represented in only one (or
a few) genome are interpreted as the result of recent
acquisitions via HGT of genes that were absent in the last
common ancestor of the group under study (Fig. 12.8b).
However, HGT is not the only process that can lead to
such gene distribution patterns. They can correspond to
genes of recent origin, namely, which emerged in a specific
genome (or lineage). In this case, no homologue of the
studied gene is expected to be present in other genomes (or
lineages). By contrast, if homologues of the gene are
detected in genomes (or lineages) other than those under
study, the hypothesis of an acquisition through HGT would
be the most likely (Fig. 12.8b).
12.3.2.2 Limits
Although its principle is very simple and intuitive, this
approach may lead to erroneous results. First, the fact that
a gene is common to all members of a group does not
S 2
S 3
S 4 S 5
S 6
S 7
S 8
S 9
S 10
S 11
S 12
S 13
S 14
S 16
S 17
S 18
S 19
S 20
S 21 S 22
S 23
S 24
S 15
S 1
Fig. 12.7 Wrong inference of HGT due to poor or biased taxonomic
sampling. Based on sequences available in public databases (branches
in solid lines), S 10 the sequence under study (in blue) displays the
highest similarity with sequences S 2 and S 8 (in red), although it is
more closely related to sequences S 16 , S 18 , S 19 , S 20 , S 22 , and S 24 .
In fact, due to evolving rate differences, S 10 appears as more similar
to S 2 and S 8 that evolve slowly than to its closest relatives, which
display higher evolutionary rates. Accordingly, based on sequence
similarity, an HGT from lineages S 2 or S 8 to S 10 will be postulated.
This conclusion is however erroneous and could have been avoided if
the phylogeny of the sequences had been rebuilt and/or if the taxonomic
diversity of the studied groups had been better represented, that is to
say, if sequences in green and/or S 17 and S 23 had been available
Table 12.1 Number of fully sequenced genomes deposited in the public database GenBank
Phylum/class
Nb of genomes
Phylum/class
Nb of genomes
Phylum/class
Nb of genomes
Crenarchaeota
53
Chlamydiae
113
Gammaproteobacteria
557
Euryarchaeota
101
Chlorobi
11
Gemmatimonadetes
1
Korarchaeota
1
Chloroflexi
20
Ignavibacteriae
2
Nanoarchaeota
1
Chrysiogenetes
1
Lentisphaerae
0
Thaumarchaeota
4
Cyanobacteria
74
Nitrospirae
4
Acidobacteria
8
Deferribacteres
4
Planctomycetes
6
Actinobacteria
274
Deinococcus-Thermus
20
Spirochaetes
58
Alphaproteobacteria
246
Delta/epsilon-proteobacteria
158
Synergistetes
5
Aquificae
12
Dictyoglomi
2
Tenericutes
77
Armatimonadetes
1
Elusimicrobia
1
Thermodesulfobacteria
3
Bacteroidetes
95
Fibrobacteres
2
Thermotogae
16
Betaproteobacteria
144
Firmicutes
581
Verrucomicrobia
5
Caldiserica
1
Fusobacteria
9
Source: NCBI, 20 October 2013
Archaeal phyla are underlined
456
C. Brochier-Armanet and D. Moreira