

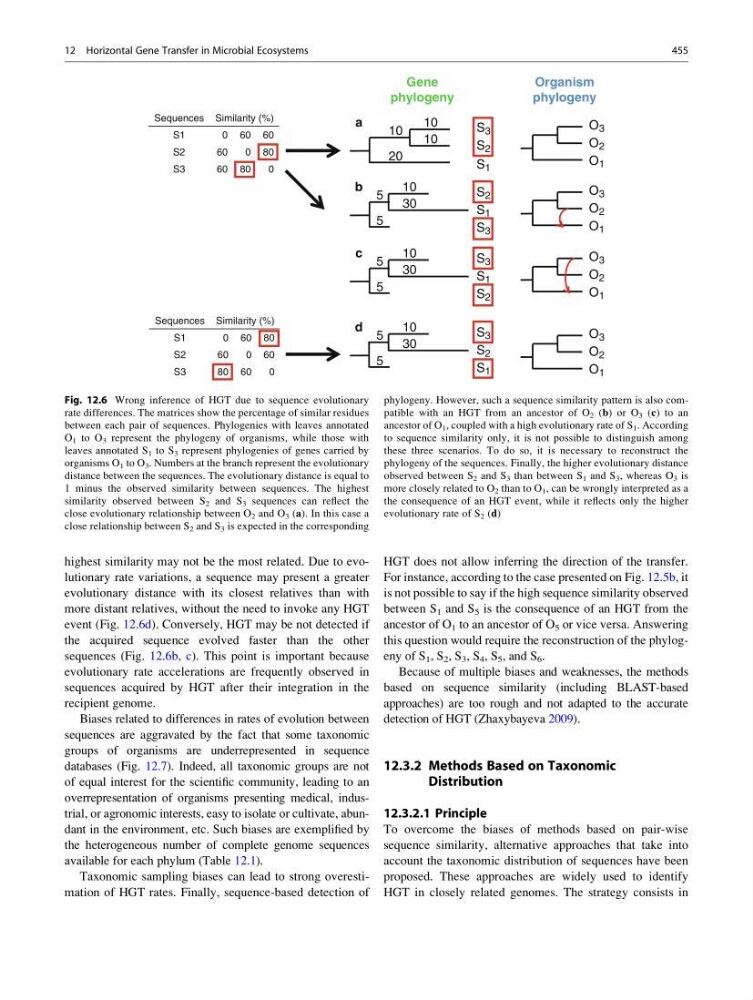
highest similarity may not be the most related. Due to evolutionary rate variations, a sequence may present a greater
evolutionary distance with its closest relatives than with
more distant relatives, without the need to invoke any HGT
event (Fig. 12.6d). Conversely, HGT may be not detected if
the acquired sequence evolved faster than the other
sequences (Fig. 12.6b, c). This point is important because
evolutionary rate accelerations are frequently observed in
sequences acquired by HGT after their integration in the
recipient genome.
Biases related to differences in rates of evolution between
sequences are aggravated by the fact that some taxonomic
groups of organisms are underrepresented in sequence
databases (Fig. 12.7). Indeed, all taxonomic groups are not
of equal interest for the scientific community, leading to an
overrepresentation of organisms presenting medical, industrial, or agronomic interests, easy to isolate or cultivate, abundant in the environment, etc. Such biases are exemplified by
the heterogeneous number of complete genome sequences
available for each phylum (Table 12.1).
Taxonomic sampling biases can lead to strong overestimation of HGT rates. Finally, sequence-based detection of
HGT does not allow inferring the direction of the transfer.
For instance, according to the case presented on Fig. 12.5b, it
is not possible to say if the high sequence similarity observed
between S 1 and S 5 is the consequence of an HGT from the
ancestor of O 1 to an ancestor of O 5 or vice versa. Answering
this question would require the reconstruction of the phylogeny of S 1 , S 2 , S 3 , S 4 , S 5 , and S 6 .
Because of multiple biases and weaknesses, the methods
based on sequence similarity (including BLAST-based
approaches) are too rough and not adapted to the accurate
detection of HGT (Zhaxybayeva 2009).
12.3.2 Methods Based on Taxonomic
Distribution
12.3.2.1 Principle
To overcome the biases of methods based on pair-wise
sequence similarity, alternative approaches that take into
account the taxonomic distribution of sequences have been
proposed. These approaches are widely used to identify
HGT in closely related genomes. The strategy consists in
Sequences Similarity (%)
S1
0 60 60
S2
60
0 80
S3
60 80
0
Sequences Similarity (%)
S1
0 60 80
S2
60
0 60
S3
80 60
0
Organism
phylogeny
O 3
O 2
O 1
a
10
10
10
20
S 3
S 2
S 1
d
10
30
5
5
S 3
S 2
S 1
Gene
phylogeny
O 3
O 2
O 1
b
10
30
5
5
S 2
S 1
S 3
O 3
O 2
O 1
c
10
30
5
5
S 3
S 1
S 2
O 3
O 2
O 1
Fig. 12.6 Wrong inference of HGT due to sequence evolutionary
rate differences. The matrices show the percentage of similar residues
between each pair of sequences. Phylogenies with leaves annotated
O 1 to O 3 represent the phylogeny of organisms, while those with
leaves annotated S 1 to S 3 represent phylogenies of genes carried by
organisms O 1 to O 3 . Numbers at the branch represent the evolutionary
distance between the sequences. The evolutionary distance is equal to
1 minus the observed similarity between sequences. The highest
similarity observed between S 2 and S 3 sequences can reflect the
close evolutionary relationship between O 2 and O 3 (a). In this case a
close relationship between S 2 and S 3 is expected in the corresponding
phylogeny. However, such a sequence similarity pattern is also compatible with an HGT from an ancestor of O 2 (b) or O 3 (c) to an
ancestor of O 1 , coupled with a high evolutionary rate of S 1 . According
to sequence similarity only, it is not possible to distinguish among
these three scenarios. To do so, it is necessary to reconstruct the
phylogeny of the sequences. Finally, the higher evolutionary distance
observed between S 2 and S 3 than between S 1 and S 3 , whereas O 3 is
more closely related to O 2 than to O 1 , can be wrongly interpreted as a
the consequence of an HGT event, while it reflects only the higher
evolutionary rate of S 2 (d)
12 Horizontal Gene Transfer in Microbial Ecosystems
455
evolutionary distance with its closest relatives than with
more distant relatives, without the need to invoke any HGT
event (Fig. 12.6d). Conversely, HGT may be not detected if
the acquired sequence evolved faster than the other
sequences (Fig. 12.6b, c). This point is important because
evolutionary rate accelerations are frequently observed in
sequences acquired by HGT after their integration in the
recipient genome.
Biases related to differences in rates of evolution between
sequences are aggravated by the fact that some taxonomic
groups of organisms are underrepresented in sequence
databases (Fig. 12.7). Indeed, all taxonomic groups are not
of equal interest for the scientific community, leading to an
overrepresentation of organisms presenting medical, industrial, or agronomic interests, easy to isolate or cultivate, abundant in the environment, etc. Such biases are exemplified by
the heterogeneous number of complete genome sequences
available for each phylum (Table 12.1).
Taxonomic sampling biases can lead to strong overestimation of HGT rates. Finally, sequence-based detection of
HGT does not allow inferring the direction of the transfer.
For instance, according to the case presented on Fig. 12.5b, it
is not possible to say if the high sequence similarity observed
between S 1 and S 5 is the consequence of an HGT from the
ancestor of O 1 to an ancestor of O 5 or vice versa. Answering
this question would require the reconstruction of the phylogeny of S 1 , S 2 , S 3 , S 4 , S 5 , and S 6 .
Because of multiple biases and weaknesses, the methods
based on sequence similarity (including BLAST-based
approaches) are too rough and not adapted to the accurate
detection of HGT (Zhaxybayeva 2009).
12.3.2 Methods Based on Taxonomic
Distribution
12.3.2.1 Principle
To overcome the biases of methods based on pair-wise
sequence similarity, alternative approaches that take into
account the taxonomic distribution of sequences have been
proposed. These approaches are widely used to identify
HGT in closely related genomes. The strategy consists in
Sequences Similarity (%)
S1
0 60 60
S2
60
0 80
S3
60 80
0
Sequences Similarity (%)
S1
0 60 80
S2
60
0 60
S3
80 60
0
Organism
phylogeny
O 3
O 2
O 1
a
10
10
10
20
S 3
S 2
S 1
d
10
30
5
5
S 3
S 2
S 1
Gene
phylogeny
O 3
O 2
O 1
b
10
30
5
5
S 2
S 1
S 3
O 3
O 2
O 1
c
10
30
5
5
S 3
S 1
S 2
O 3
O 2
O 1
Fig. 12.6 Wrong inference of HGT due to sequence evolutionary
rate differences. The matrices show the percentage of similar residues
between each pair of sequences. Phylogenies with leaves annotated
O 1 to O 3 represent the phylogeny of organisms, while those with
leaves annotated S 1 to S 3 represent phylogenies of genes carried by
organisms O 1 to O 3 . Numbers at the branch represent the evolutionary
distance between the sequences. The evolutionary distance is equal to
1 minus the observed similarity between sequences. The highest
similarity observed between S 2 and S 3 sequences can reflect the
close evolutionary relationship between O 2 and O 3 (a). In this case a
close relationship between S 2 and S 3 is expected in the corresponding
phylogeny. However, such a sequence similarity pattern is also compatible with an HGT from an ancestor of O 2 (b) or O 3 (c) to an
ancestor of O 1 , coupled with a high evolutionary rate of S 1 . According
to sequence similarity only, it is not possible to distinguish among
these three scenarios. To do so, it is necessary to reconstruct the
phylogeny of the sequences. Finally, the higher evolutionary distance
observed between S 2 and S 3 than between S 1 and S 3 , whereas O 3 is
more closely related to O 2 than to O 1 , can be wrongly interpreted as a
the consequence of an HGT event, while it reflects only the higher
evolutionary rate of S 2 (d)
12 Horizontal Gene Transfer in Microbial Ecosystems
455