

complete genome sequences revealed many cases of HGTs
and that HGT rates might have been likely underestimated.
This issue is now a major challenge in the genomic and postgenomic eras, as exemplified by the multiplication of the
studies aiming at estimating the frequency of HGT in
genomes and microbial populations. In fact, despite the apparent simplicity of the question (how many genes in a genome
have been acquired through HGT?), providing an answer has
turned out to be very difficult. Two main approaches have
been developed to address this question. Methods of the first
category are called extrinsic because they are based on the
comparison of sequences from different genomes. They are
presented in Sects. 12.3.1, 12.3.2, and 12.3.3. By contrast,
methods belonging to the second category rely on the detection of irregularities within genome sequences. They are
called intrinsic and are presented in Sect. 12.3.4.
12.3.1 Methods Based on Sequence Similarity
12.3.1.1 Principle
The more intuitive approach to detect HGT is based on the
comparison of homologous sequences from different
genomes. The rationale is that the more similar are two
homologous sequences, the more related they are. Indeed,
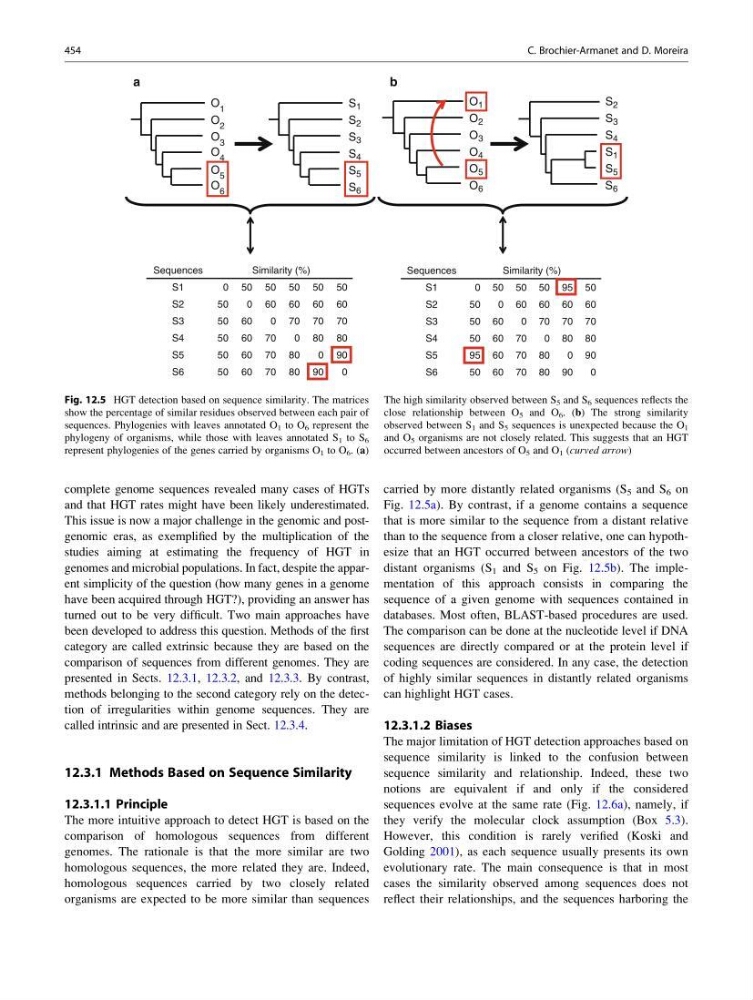
homologous sequences carried by two closely related
organisms are expected to be more similar than sequences
carried by more distantly related organisms (S 5 and S 6 on
Fig. 12.5a). By contrast, if a genome contains a sequence
that is more similar to the sequence from a distant relative
than to the sequence from a closer relative, one can hypothesize that an HGT occurred between ancestors of the two
distant organisms (S 1 and S 5 on Fig. 12.5b). The implementation of this approach consists in comparing the
sequence of a given genome with sequences contained in
databases. Most often, BLAST-based procedures are used.
The comparison can be done at the nucleotide level if DNA
sequences are directly compared or at the protein level if
coding sequences are considered. In any case, the detection
of highly similar sequences in distantly related organisms
can highlight HGT cases.
12.3.1.2 Biases
The major limitation of HGT detection approaches based on
sequence similarity is linked to the confusion between
sequence similarity and relationship. Indeed, these two
notions are equivalent if and only if the considered
sequences evolve at the same rate (Fig. 12.6a), namely, if
they verify the molecular clock assumption (Box 5.3).
However, this condition is rarely verified (Koski and
Golding 2001), as each sequence usually presents its own
evolutionary rate. The main consequence is that in most
cases the similarity observed among sequences does not
reflect their relationships, and the sequences harboring the
a
b
O 1
O 2
O 3
O 4
O 5
O 6
S 2
S 3
S 4
S 1
S 5
S 6
O 1
O 2
O 3
O 4
O 5
O 6
Sequences
Similarity (%)
S1
0 50 50 50 50 50
S2
50
0 60 60 60 60
S3
50 60
0 70 70 70
S4
50 60 70
0 80 80
S5
50 60 70 80
0 90
S6
50 60 70 80 90
0
Sequences
Similarity (%)
S1
0 50 50 50 95 50
S2
50
0 60 60 60 60
S3
50 60
0 70 70 70
S4
50 60 70
0 80 80
S5
95 60 70 80
0 90
S6
50 60 70 80 90
0
S 1
S 2
S 3
S 4
S 5
S 6
Fig. 12.5 HGT detection based on sequence similarity. The matrices
show the percentage of similar residues observed between each pair of
sequences. Phylogenies with leaves annotated O 1 to O 6 represent the
phylogeny of organisms, while those with leaves annotated S 1 to S 6
represent phylogenies of the genes carried by organisms O 1 to O 6 . (a)
The high similarity observed between S 5 and S 6 sequences reflects the
close relationship between O 5 and O 6 . (b) The strong similarity
observed between S 1 and S 5 sequences is unexpected because the O 1
and O 5 organisms are not closely related. This suggests that an HGT
occurred between ancestors of O 5 and O 1 (curved arrow)
454
C. Brochier-Armanet and D. Moreira
and that HGT rates might have been likely underestimated.
This issue is now a major challenge in the genomic and postgenomic eras, as exemplified by the multiplication of the
studies aiming at estimating the frequency of HGT in
genomes and microbial populations. In fact, despite the apparent simplicity of the question (how many genes in a genome
have been acquired through HGT?), providing an answer has
turned out to be very difficult. Two main approaches have
been developed to address this question. Methods of the first
category are called extrinsic because they are based on the
comparison of sequences from different genomes. They are
presented in Sects. 12.3.1, 12.3.2, and 12.3.3. By contrast,
methods belonging to the second category rely on the detection of irregularities within genome sequences. They are
called intrinsic and are presented in Sect. 12.3.4.
12.3.1 Methods Based on Sequence Similarity
12.3.1.1 Principle
The more intuitive approach to detect HGT is based on the
comparison of homologous sequences from different
genomes. The rationale is that the more similar are two
homologous sequences, the more related they are. Indeed,
homologous sequences carried by two closely related
organisms are expected to be more similar than sequences
carried by more distantly related organisms (S 5 and S 6 on
Fig. 12.5a). By contrast, if a genome contains a sequence
that is more similar to the sequence from a distant relative
than to the sequence from a closer relative, one can hypothesize that an HGT occurred between ancestors of the two
distant organisms (S 1 and S 5 on Fig. 12.5b). The implementation of this approach consists in comparing the
sequence of a given genome with sequences contained in
databases. Most often, BLAST-based procedures are used.
The comparison can be done at the nucleotide level if DNA
sequences are directly compared or at the protein level if
coding sequences are considered. In any case, the detection
of highly similar sequences in distantly related organisms
can highlight HGT cases.
12.3.1.2 Biases
The major limitation of HGT detection approaches based on
sequence similarity is linked to the confusion between
sequence similarity and relationship. Indeed, these two
notions are equivalent if and only if the considered
sequences evolve at the same rate (Fig. 12.6a), namely, if
they verify the molecular clock assumption (Box 5.3).
However, this condition is rarely verified (Koski and
Golding 2001), as each sequence usually presents its own
evolutionary rate. The main consequence is that in most
cases the similarity observed among sequences does not
reflect their relationships, and the sequences harboring the
a
b
O 1
O 2
O 3
O 4
O 5
O 6
S 2
S 3
S 4
S 1
S 5
S 6
O 1
O 2
O 3
O 4
O 5
O 6
Sequences
Similarity (%)
S1
0 50 50 50 50 50
S2
50
0 60 60 60 60
S3
50 60
0 70 70 70
S4
50 60 70
0 80 80
S5
50 60 70 80
0 90
S6
50 60 70 80 90
0
Sequences
Similarity (%)
S1
0 50 50 50 95 50
S2
50
0 60 60 60 60
S3
50 60
0 70 70 70
S4
50 60 70
0 80 80
S5
95 60 70 80
0 90
S6
50 60 70 80 90
0
S 1
S 2
S 3
S 4
S 5
S 6
Fig. 12.5 HGT detection based on sequence similarity. The matrices
show the percentage of similar residues observed between each pair of
sequences. Phylogenies with leaves annotated O 1 to O 6 represent the
phylogeny of organisms, while those with leaves annotated S 1 to S 6
represent phylogenies of the genes carried by organisms O 1 to O 6 . (a)
The high similarity observed between S 5 and S 6 sequences reflects the
close relationship between O 5 and O 6 . (b) The strong similarity
observed between S 1 and S 5 sequences is unexpected because the O 1
and O 5 organisms are not closely related. This suggests that an HGT
occurred between ancestors of O 5 and O 1 (curved arrow)
454
C. Brochier-Armanet and D. Moreira