

in strain A that are “positive” in strain B. The resulting
coefficient is expressed as a percentage of similarity between
two strains. It is important to note that the Jaccard coefficient
considers only characters with a positive result in one or
other of the two strains compared. There are other indices
such as the Sokal and Michener index that take into account
the sharing of negative characters. A S (AB) of 70 % is
expected at the species level. The calculation of similarity
coefficients among all pairs of strains provides a similarity
matrix (Fig. 6.5b) that can be plotted as a dendrogram where
the most similar strains are placed close together (Fig. 6.5c).
6.4.2 Phylogenetic Trees
In addition to phenotypic characterization, the identification
and the classification of new isolates relies more and more
frequently on a phylogenetic analysis. Besides deciphering
of relationships among taxa, this approach allows studying
the biodiversity and classifying prokaryotes via molecular
techniques that do not require the direct cultivation of the
corresponding microorganisms (cf. Sect. 8.4.2). A phylogenetic analysis is used to determine kinship relationships
between taxa (strains, species, genera, etc.) and therefore
allows identifying the closest known relatives of the strain
of interest. The reference marker used for this analysis is the
gene coding for 16S rRNA. Identification based on this gene
opens the question of the similarity threshold above in which
it is assumed that two closely related isolates belong to the
same species which is classically defined by DNA/DNA
hybridization (Wayne et al. 1987). Stackebrandt and Goebel
(1994) suggested that a threshold of 70 % of genomic DNA
hybridization between strains of the same species
corresponded to a percent identity of at least 97 % of their
genes encoding 16S rRNA.
One has to understand the 97 % level as a threshold below
which there is no need to make a DNA/DNA hybridization
because the two strains belong to different species, but this
does not mean that two strains harboring more than 97 %
identity at the 16S rDNA level always belong to the same
Organism 1
Organism 2
DNA preparation
DNA extraction
& Fragmentation
DNA extraction,
Fragmentation & labeling with P32 P
Denaturation
P
P
P
P
P
P
P
P
P
P
P
P
P
P
P
P
P
P
P
P
P
P
P
P
P
P
Compared organisms
Organism 1
Organism 1
X
P
P
P
P
P
P
P
P
P
P
P
P
P
Denaturation
100% of hybridization
(control)
Hybridization
Organism 1
Organism 2
X
P
P
P
P
P
P
P
P
P
P
P
P
P
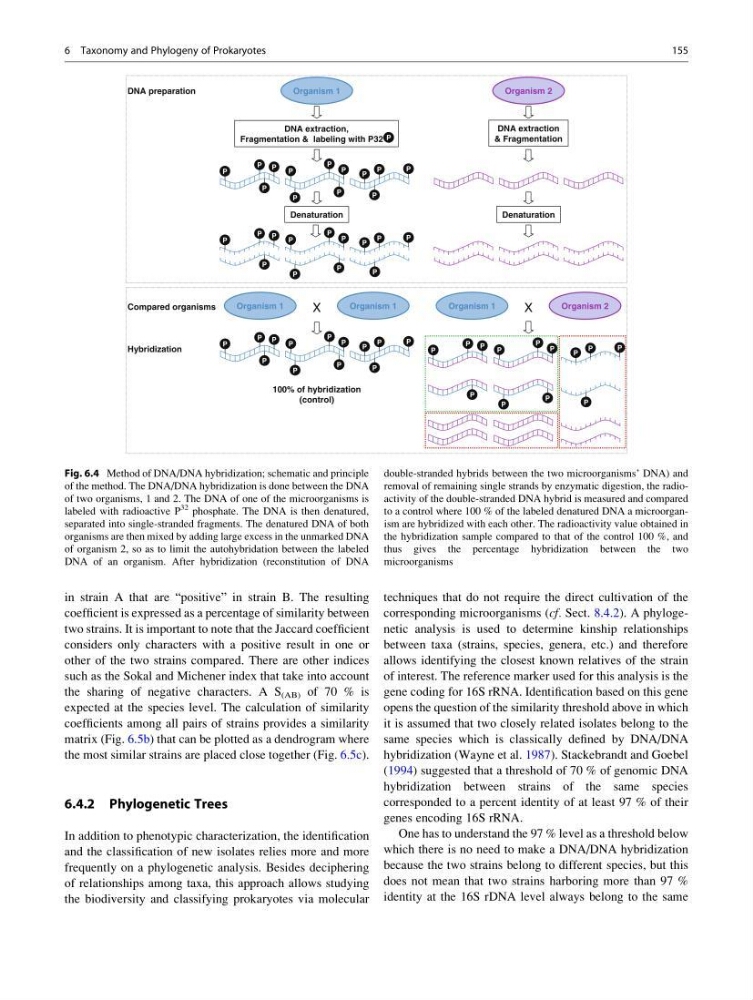
Fig. 6.4 Method of DNA/DNA hybridization; schematic and principle
of the method. The DNA/DNA hybridization is done between the DNA
of two organisms, 1 and 2. The DNA of one of the microorganisms is
labeled with radioactive P
32 phosphate. The DNA is then denatured,
separated into single-stranded fragments. The denatured DNA of both
organisms are then mixed by adding large excess in the unmarked DNA
of organism 2, so as to limit the autohybridation between the labeled
DNA of an organism. After hybridization (reconstitution of DNA
double-stranded hybrids between the two microorganisms’ DNA) and
removal of remaining single strands by enzymatic digestion, the radioactivity of the double-stranded DNA hybrid is measured and compared
to a control where 100 % of the labeled denatured DNA a microorganism are hybridized with each other. The radioactivity value obtained in
the hybridization sample compared to that of the control 100 %, and
thus gives the percentage hybridization between the two
microorganisms
6 Taxonomy and Phylogeny of Prokaryotes
155
coefficient is expressed as a percentage of similarity between
two strains. It is important to note that the Jaccard coefficient
considers only characters with a positive result in one or
other of the two strains compared. There are other indices
such as the Sokal and Michener index that take into account
the sharing of negative characters. A S (AB) of 70 % is
expected at the species level. The calculation of similarity
coefficients among all pairs of strains provides a similarity
matrix (Fig. 6.5b) that can be plotted as a dendrogram where
the most similar strains are placed close together (Fig. 6.5c).
6.4.2 Phylogenetic Trees
In addition to phenotypic characterization, the identification
and the classification of new isolates relies more and more
frequently on a phylogenetic analysis. Besides deciphering
of relationships among taxa, this approach allows studying
the biodiversity and classifying prokaryotes via molecular
techniques that do not require the direct cultivation of the
corresponding microorganisms (cf. Sect. 8.4.2). A phylogenetic analysis is used to determine kinship relationships
between taxa (strains, species, genera, etc.) and therefore
allows identifying the closest known relatives of the strain
of interest. The reference marker used for this analysis is the
gene coding for 16S rRNA. Identification based on this gene
opens the question of the similarity threshold above in which
it is assumed that two closely related isolates belong to the
same species which is classically defined by DNA/DNA
hybridization (Wayne et al. 1987). Stackebrandt and Goebel
(1994) suggested that a threshold of 70 % of genomic DNA
hybridization between strains of the same species
corresponded to a percent identity of at least 97 % of their
genes encoding 16S rRNA.
One has to understand the 97 % level as a threshold below
which there is no need to make a DNA/DNA hybridization
because the two strains belong to different species, but this
does not mean that two strains harboring more than 97 %
identity at the 16S rDNA level always belong to the same
Organism 1
Organism 2
DNA preparation
DNA extraction
& Fragmentation
DNA extraction,
Fragmentation & labeling with P32 P
Denaturation
P
P
P
P
P
P
P
P
P
P
P
P
P
P
P
P
P
P
P
P
P
P
P
P
P
P
Compared organisms
Organism 1
Organism 1
X
P
P
P
P
P
P
P
P
P
P
P
P
P
Denaturation
100% of hybridization
(control)
Hybridization
Organism 1
Organism 2
X
P
P
P
P
P
P
P
P
P
P
P
P
P
Fig. 6.4 Method of DNA/DNA hybridization; schematic and principle
of the method. The DNA/DNA hybridization is done between the DNA
of two organisms, 1 and 2. The DNA of one of the microorganisms is
labeled with radioactive P
32 phosphate. The DNA is then denatured,
separated into single-stranded fragments. The denatured DNA of both
organisms are then mixed by adding large excess in the unmarked DNA
of organism 2, so as to limit the autohybridation between the labeled
DNA of an organism. After hybridization (reconstitution of DNA
double-stranded hybrids between the two microorganisms’ DNA) and
removal of remaining single strands by enzymatic digestion, the radioactivity of the double-stranded DNA hybrid is measured and compared
to a control where 100 % of the labeled denatured DNA a microorganism are hybridized with each other. The radioactivity value obtained in
the hybridization sample compared to that of the control 100 %, and
thus gives the percentage hybridization between the two
microorganisms
6 Taxonomy and Phylogeny of Prokaryotes
155