

genetic exchanges among prokaryotes, the use of several
alternative markers is recommended. With the increase in
sequencing capacity, it is quite possible that in a few years,
the complete genome sequence will be required for the
identification of an isolate.
6.4
Dendrograms and Phylogenetic Trees
6.4.1 Phenotypic Dendrograms, Numerical
Taxonomy
Numerical taxonomy is associated with artificial classifications, as opposed to phylogenies that are associated
with natural classifications (see below). Historically, numerical taxonomy appeared before molecular phylogenies, and
today it can be used in addition to phylogenetic analyses for
characterization at the species level. These dendrograms
should not be confused with phylogenetic trees. The former
represent phenotypic similarities, whereas the latter represent relations of kinship.
The principle of numerical taxonomy relies on
comparisons of numerous phenotypic features for a set of
strains in order to group them according to their degree of
phenotypic similarity. Usually, more than 50 independent
characters are used, but in some cases, a higher number may
be required (e.g., up to 150 characters for the study of
aerobic heterotrophic bacteria). Phenotypic characteristics
tested must be independent, namely, overlapping characters
must be avoided. The features of each strain are translated
into “positive” or “negative” in a binary manner and gathered into a character matrix (Fig. 6.5a). The similarity
between strains is subsequently quantified by a similarity
coefficient S (AB) , such as that of Jaccard, through pairwise
comparisons of the strains. The S (AB) coefficient between
two strains (Jaccard coefficient) is defined as follows:
S j AB
ð Þ ¼ a= a þ b þ c
ð
Þ
In this formula, a represents the number of “positive”
characters shared by the two trains, b corresponds to the
number of “positive” features for strain A that are “negative”
in strain B, whereas c is the number of “negative” characters
0
10
20
30
40
50
60
70
80
90
100
Acidobacteria
Actinobacteria
Alphaproteobacteria
Aquificae
Bacteroidetes/Chlorobi
Betaproteobacteria
PVC
(Planctomycetales/Chlamydia/Verrucomicrobia)
Chloroflexi
Cyanobacteria
Thermus/Deinococcus
Deltaproteobacteria
Epsilonproteobacteria
Firmicutes
Fusobacteria
Gammaproteobacteria
Spirochaetes
Thermotogae
Euryarchaeota
Crenarchaeota
Nanoarchaeota
G+C percentage in genomes
Taxonomic groups
Bacteria
Archaea
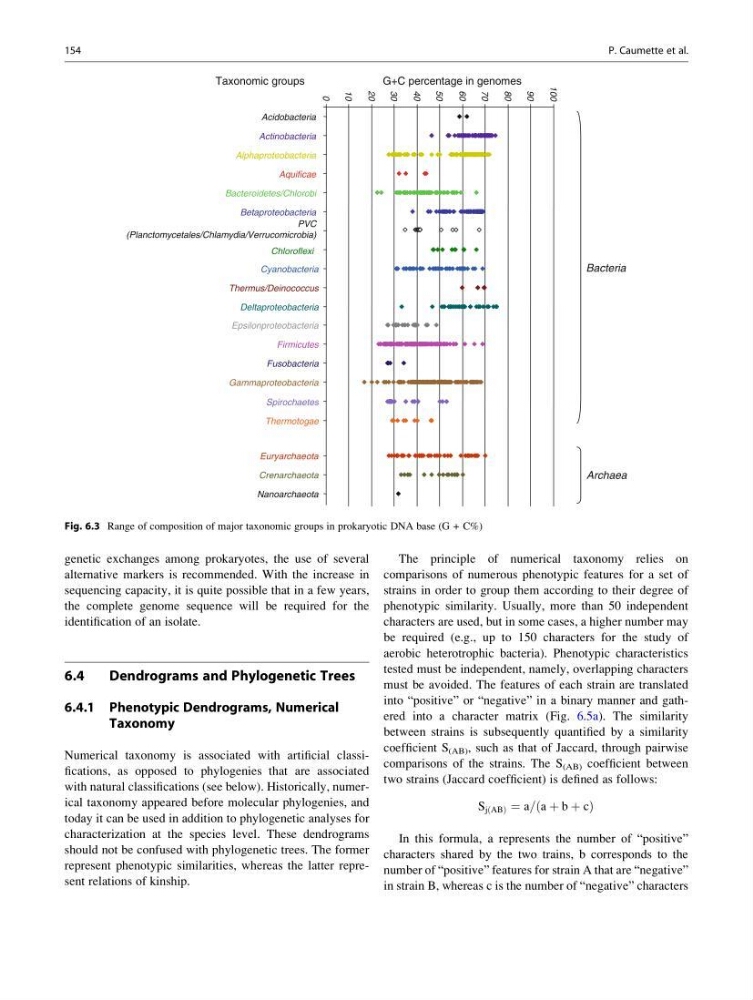
Fig. 6.3 Range of composition of major taxonomic groups in prokaryotic DNA base (G + C%)
154
P. Caumette et al.
alternative markers is recommended. With the increase in
sequencing capacity, it is quite possible that in a few years,
the complete genome sequence will be required for the
identification of an isolate.
6.4
Dendrograms and Phylogenetic Trees
6.4.1 Phenotypic Dendrograms, Numerical
Taxonomy
Numerical taxonomy is associated with artificial classifications, as opposed to phylogenies that are associated
with natural classifications (see below). Historically, numerical taxonomy appeared before molecular phylogenies, and
today it can be used in addition to phylogenetic analyses for
characterization at the species level. These dendrograms
should not be confused with phylogenetic trees. The former
represent phenotypic similarities, whereas the latter represent relations of kinship.
The principle of numerical taxonomy relies on
comparisons of numerous phenotypic features for a set of
strains in order to group them according to their degree of
phenotypic similarity. Usually, more than 50 independent
characters are used, but in some cases, a higher number may
be required (e.g., up to 150 characters for the study of
aerobic heterotrophic bacteria). Phenotypic characteristics
tested must be independent, namely, overlapping characters
must be avoided. The features of each strain are translated
into “positive” or “negative” in a binary manner and gathered into a character matrix (Fig. 6.5a). The similarity
between strains is subsequently quantified by a similarity
coefficient S (AB) , such as that of Jaccard, through pairwise
comparisons of the strains. The S (AB) coefficient between
two strains (Jaccard coefficient) is defined as follows:
S j AB
ð Þ ¼ a= a þ b þ c
ð
Þ
In this formula, a represents the number of “positive”
characters shared by the two trains, b corresponds to the
number of “positive” features for strain A that are “negative”
in strain B, whereas c is the number of “negative” characters
0
10
20
30
40
50
60
70
80
90
100
Acidobacteria
Actinobacteria
Alphaproteobacteria
Aquificae
Bacteroidetes/Chlorobi
Betaproteobacteria
PVC
(Planctomycetales/Chlamydia/Verrucomicrobia)
Chloroflexi
Cyanobacteria
Thermus/Deinococcus
Deltaproteobacteria
Epsilonproteobacteria
Firmicutes
Fusobacteria
Gammaproteobacteria
Spirochaetes
Thermotogae
Euryarchaeota
Crenarchaeota
Nanoarchaeota
G+C percentage in genomes
Taxonomic groups
Bacteria
Archaea
Fig. 6.3 Range of composition of major taxonomic groups in prokaryotic DNA base (G + C%)
154
P. Caumette et al.