

60
D. A. MCGILL:
Table 1. Indian Ocean data in the archives of the U.S. National Oceanographic Data Center, World
Data Center A. (NO DC, 1969)
I. Distribution of station data by months or seasons, terminology for seasonal cycle adapted from
QASIM, BHATIATHIRI and ABIDI (1968).
1. Jan. - Feb. - Mar. ("premonsoon"): 2709 stations
2. Apr. - May - June ("onset, SW monsoon"): 2270 stations
3. July- Aug. -Sept. ("end, SW monsoon"): 2166 stations
4. Oct. - Nov. - Dec. ("post-monsoon"): 2391 stations
Total, all months: 9536 stations.
II. Distribution of station data by depth range
10°
depth range to bottom
1. Total of all stations:
9536
surface to 450 m:
3509 stns
2. Total exceeding 450 m: 6027
bottom at 450-950 m: 1052 stns
3. Total exceeding 950 m: 4975
bottom at 950-1950 m: 1993 stns
4. Total exceeding 1950 m: 2982
bottom more than 1950 m: 2982 stns
Total stations, all depths: 9536
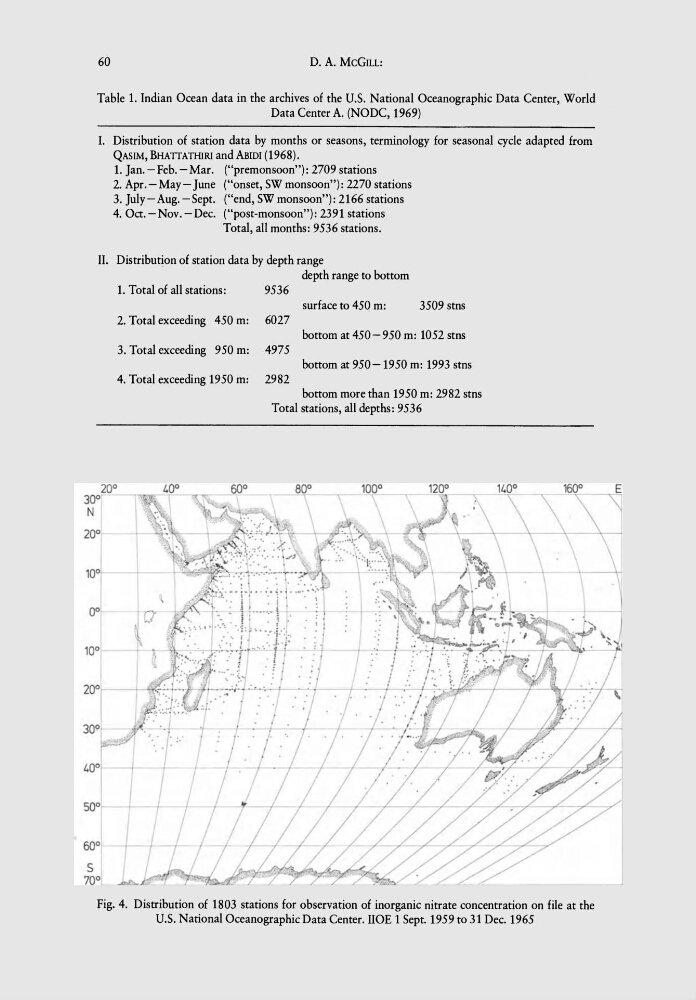
Fig. 4. Distribution of 1803 stations for observation of inorganic nitrate concentration on file at the
U.S. National Oceanographic Data Center. lIOE 1 Sept. 1959 to 31 Dec. 1965
D. A. MCGILL:
Table 1. Indian Ocean data in the archives of the U.S. National Oceanographic Data Center, World
Data Center A. (NO DC, 1969)
I. Distribution of station data by months or seasons, terminology for seasonal cycle adapted from
QASIM, BHATIATHIRI and ABIDI (1968).
1. Jan. - Feb. - Mar. ("premonsoon"): 2709 stations
2. Apr. - May - June ("onset, SW monsoon"): 2270 stations
3. July- Aug. -Sept. ("end, SW monsoon"): 2166 stations
4. Oct. - Nov. - Dec. ("post-monsoon"): 2391 stations
Total, all months: 9536 stations.
II. Distribution of station data by depth range
10°
depth range to bottom
1. Total of all stations:
9536
surface to 450 m:
3509 stns
2. Total exceeding 450 m: 6027
bottom at 450-950 m: 1052 stns
3. Total exceeding 950 m: 4975
bottom at 950-1950 m: 1993 stns
4. Total exceeding 1950 m: 2982
bottom more than 1950 m: 2982 stns
Total stations, all depths: 9536
Fig. 4. Distribution of 1803 stations for observation of inorganic nitrate concentration on file at the
U.S. National Oceanographic Data Center. lIOE 1 Sept. 1959 to 31 Dec. 1965