

Light and Nutrients in the Indian Ocean
59
(1969) finds terrigenous materials at distances over 2000 km from the shore in the Bay
of Bengal and the Arabian Sea, as well as off Antarctica. Thus, PAVLOV (1961) has been
able to distinguish the optical characteristics of major water masses in part by the silt
zones between them.
ll. Studies on Nutrient Distribution
The sampling of the Indian Ocean for nutrients was conducted on a widespread basis
during HOE. Their statistics are summarized in Table 1 for the period from 1 September
1959 to 31 December 1965:
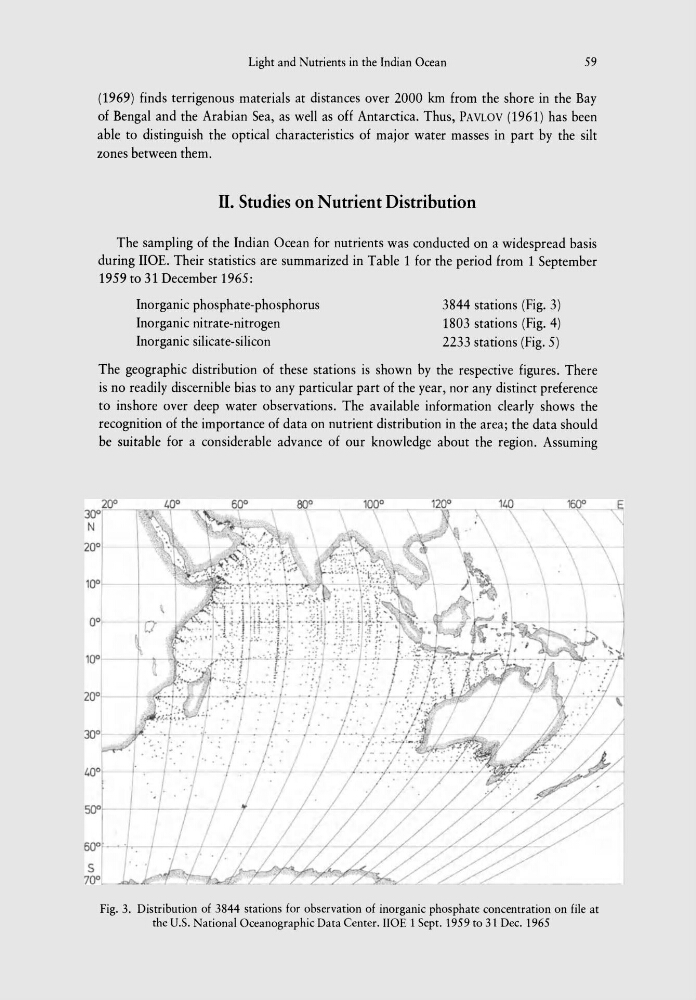
Inorganic phosphate-phosphorus
Inorganic nitrate-nitrogen
Inorganic silicate-silicon
3844 stations (Fig. 3)
1803 stations (Fig. 4)
2233 stations (Fig. 5)
The geographic distribution of these stations is shown by the respective figures. There
is no readily discernible bias to any particular part of the year, nor any distinct preference
to inshore over deep water observations. The available information clearly shows the
recognition of the importance of data on nutrient distribution in the area; the data should
be suitable for a considerable advance of our knowledge about the region. Assuming
60"
S
70"
Fig. 3. Distribution of 3844 stations for observation of inorganic phosphate concentration on file at
the U.S. National Oceanographic Data Center.IIOE 1 Sept. 1959 to 31 Dec. 1965
59
(1969) finds terrigenous materials at distances over 2000 km from the shore in the Bay
of Bengal and the Arabian Sea, as well as off Antarctica. Thus, PAVLOV (1961) has been
able to distinguish the optical characteristics of major water masses in part by the silt
zones between them.
ll. Studies on Nutrient Distribution
The sampling of the Indian Ocean for nutrients was conducted on a widespread basis
during HOE. Their statistics are summarized in Table 1 for the period from 1 September
1959 to 31 December 1965:
Inorganic phosphate-phosphorus
Inorganic nitrate-nitrogen
Inorganic silicate-silicon
3844 stations (Fig. 3)
1803 stations (Fig. 4)
2233 stations (Fig. 5)
The geographic distribution of these stations is shown by the respective figures. There
is no readily discernible bias to any particular part of the year, nor any distinct preference
to inshore over deep water observations. The available information clearly shows the
recognition of the importance of data on nutrient distribution in the area; the data should
be suitable for a considerable advance of our knowledge about the region. Assuming
60"
S
70"
Fig. 3. Distribution of 3844 stations for observation of inorganic phosphate concentration on file at
the U.S. National Oceanographic Data Center.IIOE 1 Sept. 1959 to 31 Dec. 1965