

412
R. FENAUX:
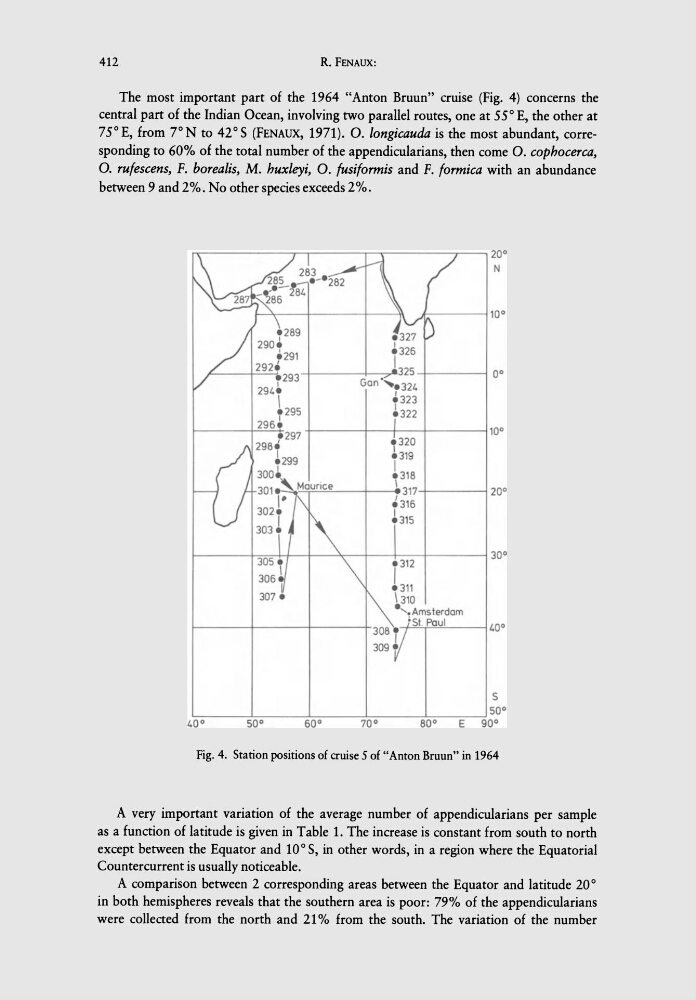
The most important part of the 1964 "Anton Bruun" cruise (Fig. 4) concerns the
central part of the Indian Ocean, involving two parallel routes, one at 55° E, the other at
75° E, from 7° N to 42 ° 5 (FENAUX, 1971). O. longicauda is the most abundant, corresponding to 60% of the total number of the appendicularians, then come O. cophocerca,
O. rufescens, F. borealis, M. huxleyi, O. fusiformis and F. formica with an abundance
between 9 and 2%. No other species exceeds 2%.
20 0
N
10°
.327
.325
1 325
0 0
Gon".324
.323
.322
10 0
.320
.319
I
~33\~
20 0
.315
.315
30 0
j312
.311
\310
.'. Ams terdom
·51. Paul
40 0
5
50°
4~O~0----~ 5~ 00 ~--~6~0~0~--~ 70 ~0 ~----~80 ~0~~ E~ 900
Fig. 4. Station positions of cruise 5 of "Anton Bruun" in 1964
A very important variation of the average number of appendicularians per sample
as a function of latitude is given in Table 1. The increase is constant from south to north
except between the Equator and 10° 5, in other words, in a region where the Equatorial
Countercurrent is usually noticeable.
A comparison between 2 corresponding areas between the Equator and latitude 20°
in both hemispheres reveals that the southern area is poor: 79% of the appendicularians
were collected from the north and 21% from the south, The variation of the number
R. FENAUX:
The most important part of the 1964 "Anton Bruun" cruise (Fig. 4) concerns the
central part of the Indian Ocean, involving two parallel routes, one at 55° E, the other at
75° E, from 7° N to 42 ° 5 (FENAUX, 1971). O. longicauda is the most abundant, corresponding to 60% of the total number of the appendicularians, then come O. cophocerca,
O. rufescens, F. borealis, M. huxleyi, O. fusiformis and F. formica with an abundance
between 9 and 2%. No other species exceeds 2%.
20 0
N
10°
.327
.325
1 325
0 0
Gon".324
.323
.322
10 0
.320
.319
I
~33\~
20 0
.315
.315
30 0
j312
.311
\310
.'. Ams terdom
·51. Paul
40 0
5
50°
4~O~0----~ 5~ 00 ~--~6~0~0~--~ 70 ~0 ~----~80 ~0~~ E~ 900
Fig. 4. Station positions of cruise 5 of "Anton Bruun" in 1964
A very important variation of the average number of appendicularians per sample
as a function of latitude is given in Table 1. The increase is constant from south to north
except between the Equator and 10° 5, in other words, in a region where the Equatorial
Countercurrent is usually noticeable.
A comparison between 2 corresponding areas between the Equator and latitude 20°
in both hemispheres reveals that the southern area is poor: 79% of the appendicularians
were collected from the north and 21% from the south, The variation of the number