

250
T. S. S. RAo:
100
Volume per haul
C':J 0.1 - 9.9
~ 10.0- 19.9
~20. 0-39 . 9
40.0-79.9
)80
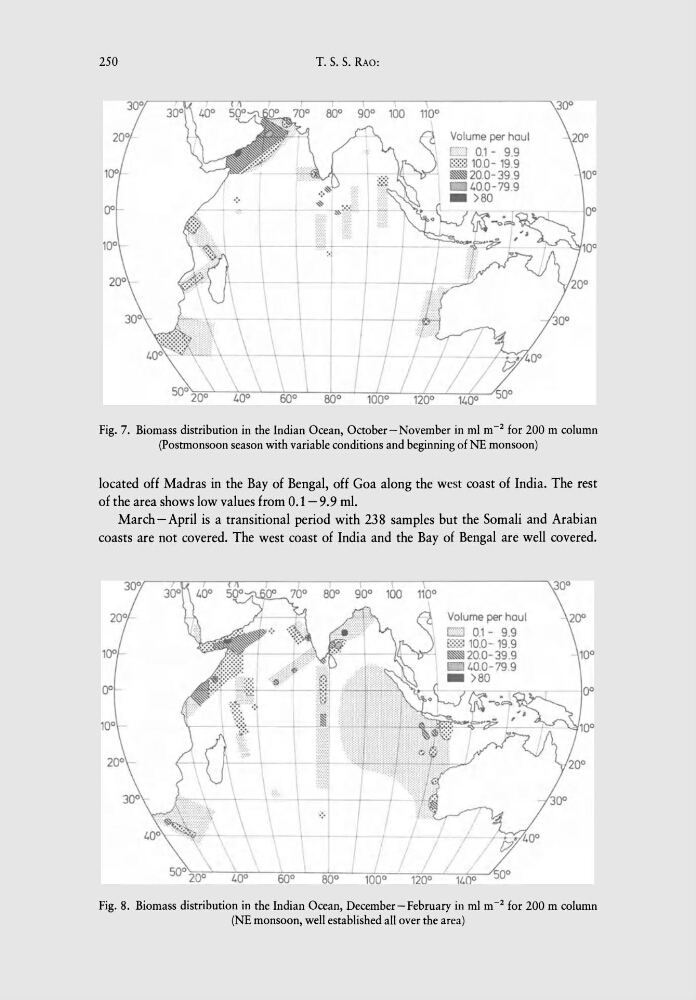
Fig. 7. Biomass distribution in the Indian Ocean, October - November in ml m -2 for 200 m column
(Postmonsoon season with variable conditions and beginning of NE monsoon)
located off Madras in the Bay of Bengal, off Goa along the west coast of India. The rest
of the area shows low values from 0.1- 9.9 m!.
March - April is a transitional period with 238 samples but the Somali and Arabian
coasts are not covered. The west coast of India and the Bay of Bengal are well covered.
Volume per haul
EZl 0.1 - 9.9
E8:3 10.0- 19.9
~20. 0-39 . 9
40.0 - 79.9
_
)80
Fig. 8. Biomass distribution in the Indian Ocean, December-February in ml m- 2 for 200 m column
(NE monsoon, well established all over the area)
T. S. S. RAo:
100
Volume per haul
C':J 0.1 - 9.9
~ 10.0- 19.9
~20. 0-39 . 9
40.0-79.9
)80
Fig. 7. Biomass distribution in the Indian Ocean, October - November in ml m -2 for 200 m column
(Postmonsoon season with variable conditions and beginning of NE monsoon)
located off Madras in the Bay of Bengal, off Goa along the west coast of India. The rest
of the area shows low values from 0.1- 9.9 m!.
March - April is a transitional period with 238 samples but the Somali and Arabian
coasts are not covered. The west coast of India and the Bay of Bengal are well covered.
Volume per haul
EZl 0.1 - 9.9
E8:3 10.0- 19.9
~20. 0-39 . 9
40.0 - 79.9
_
)80
Fig. 8. Biomass distribution in the Indian Ocean, December-February in ml m- 2 for 200 m column
(NE monsoon, well established all over the area)