

Zooplankton Studies in the Indian Ocean
3~,r-~ . . ----nr--.---'-------------~------------~
1.00
100 0
1200
Volume per haul
o 0.1- 9.9
[:ill 10D- 19.9
11.oo 50 0
249
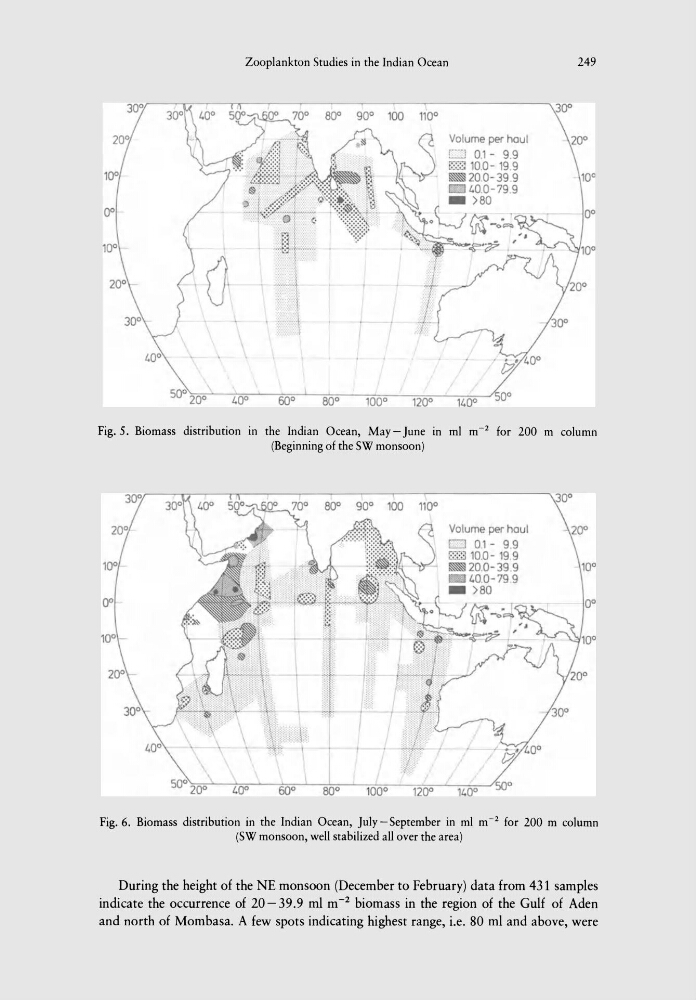
Fig. 5. Biomass distribution in the Indian Ocean, May-June in ml m- 2 for 200 m column
(Beginning of the SW monsoon)
Volume per haul
E2] 0.1 - 9,9
~ 10,0- 19,9
~20, 0-39 .9
1.0.0-79.9
_
)80
Fig. 6. Biomass distribution in the Indian Ocean, July-September in ml m- 2 for 200 m column
(SW monsoon, well stabilized all over the area)
During the height of the NE monsoon (December to February) data from 431 samples
indicate the occurrence of 20 - 39.9 ml m -2 biomass in the region of the Gulf of Aden
and north of Mombasa. A few spots indicating highest range, i.e. 80 ml and above, were
3~,r-~ . . ----nr--.---'-------------~------------~
1.00
100 0
1200
Volume per haul
o 0.1- 9.9
[:ill 10D- 19.9
11.oo 50 0
249
Fig. 5. Biomass distribution in the Indian Ocean, May-June in ml m- 2 for 200 m column
(Beginning of the SW monsoon)
Volume per haul
E2] 0.1 - 9,9
~ 10,0- 19,9
~20, 0-39 .9
1.0.0-79.9
_
)80
Fig. 6. Biomass distribution in the Indian Ocean, July-September in ml m- 2 for 200 m column
(SW monsoon, well stabilized all over the area)
During the height of the NE monsoon (December to February) data from 431 samples
indicate the occurrence of 20 - 39.9 ml m -2 biomass in the region of the Gulf of Aden
and north of Mombasa. A few spots indicating highest range, i.e. 80 ml and above, were