

248
T. S. S. RAo:
(wet zooplankton displacement volumes expressed as ml per haul taken by the IOSN)
in the Indian Ocean based on the data from 1622 samples included in the above atlas (see
map on the inside of the front cover).
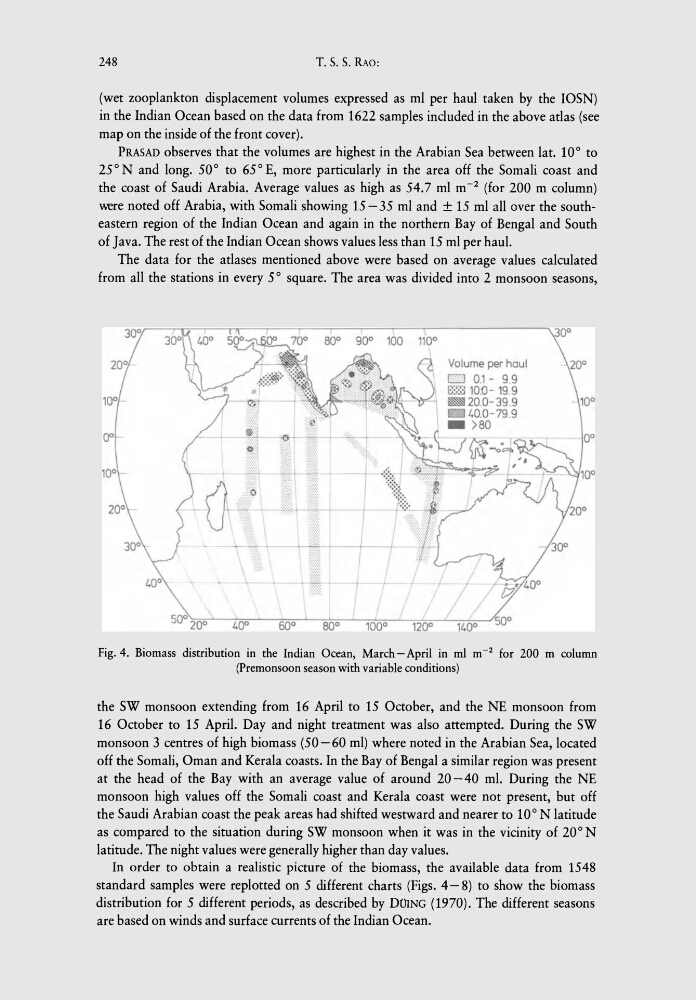
PRASAD observes that the volumes are highest in the Arabian Sea between lat. 10° to
25° N and long. 50° to 65° E, more particularly in the area off the Somali coast and
the coast of Saudi Arabia. Average values as high as 54.7 ml m- 2 (for 200 m column)
were noted off Arabia, with Somali showing 15 - 35 ml and ± 15 ml all over the southeastern region of the Indian Ocean and again in the northern Bay of Bengal and South
of Java. The rest of the Indian Ocean shows values less than 15 ml per haul.
The data for the atlases mentioned above were based on average values calculated
from all the stations in every 5 ° square. The area was divided into 2 monsoon seasons,
400
80 0
100 0
1200
Volume per haul
EJ 0.1 - 9.9
ill;:] 10. 0 - 19.9
~20.0-39 . 9
40.0-79.9
_ )80
Fig. 4. Biomass distribution in the Indian Ocean, March-April in ml m- 2 for 200 m column
(Premonsoon season with variable conditions)
the SW monsoon extending from 16 April to 15 October, and the NE monsoon from
16 October to 15 April. Day and night treatment was also attempted. During the SW
monsoon 3 centres of high biomass (50-60 ml) where noted in the Arabian Sea, located
off the Somali, Oman and Kerala coasts. In the Bay of Bengal a similar region was present
at the head of the Bay with an average value of around 20-40 m!. During the NE
monsoon high values off the Somali coast and Kerala coast were not present, but off
the Saudi Arabian coast the peak areas had shifted westward and nearer to 10° N latitude
as compared to the situation during SW monsoon when it was in the vicinity of 20° N
latitude. The night values were generally higher than day values.
In order to obtain a realistic picture of the biomass, the available data from 1548
standard samples were replotted on 5 different charts (Figs. 4- 8) to show the biomass
distribution for 5 different periods, as described by DOING (1970). The different seasons
are based on winds and surface currents of the Indian Ocean.
T. S. S. RAo:
(wet zooplankton displacement volumes expressed as ml per haul taken by the IOSN)
in the Indian Ocean based on the data from 1622 samples included in the above atlas (see
map on the inside of the front cover).
PRASAD observes that the volumes are highest in the Arabian Sea between lat. 10° to
25° N and long. 50° to 65° E, more particularly in the area off the Somali coast and
the coast of Saudi Arabia. Average values as high as 54.7 ml m- 2 (for 200 m column)
were noted off Arabia, with Somali showing 15 - 35 ml and ± 15 ml all over the southeastern region of the Indian Ocean and again in the northern Bay of Bengal and South
of Java. The rest of the Indian Ocean shows values less than 15 ml per haul.
The data for the atlases mentioned above were based on average values calculated
from all the stations in every 5 ° square. The area was divided into 2 monsoon seasons,
400
80 0
100 0
1200
Volume per haul
EJ 0.1 - 9.9
ill;:] 10. 0 - 19.9
~20.0-39 . 9
40.0-79.9
_ )80
Fig. 4. Biomass distribution in the Indian Ocean, March-April in ml m- 2 for 200 m column
(Premonsoon season with variable conditions)
the SW monsoon extending from 16 April to 15 October, and the NE monsoon from
16 October to 15 April. Day and night treatment was also attempted. During the SW
monsoon 3 centres of high biomass (50-60 ml) where noted in the Arabian Sea, located
off the Somali, Oman and Kerala coasts. In the Bay of Bengal a similar region was present
at the head of the Bay with an average value of around 20-40 m!. During the NE
monsoon high values off the Somali coast and Kerala coast were not present, but off
the Saudi Arabian coast the peak areas had shifted westward and nearer to 10° N latitude
as compared to the situation during SW monsoon when it was in the vicinity of 20° N
latitude. The night values were generally higher than day values.
In order to obtain a realistic picture of the biomass, the available data from 1548
standard samples were replotted on 5 different charts (Figs. 4- 8) to show the biomass
distribution for 5 different periods, as described by DOING (1970). The different seasons
are based on winds and surface currents of the Indian Ocean.