

224
B. KIMOR:
flow into the Arabian Sea, this being compensated by an inflow of less saline surface
waters flowing into the Gulf. Any plankton organisms carried by the latter current
towards the Persian Gulf and unable to withstand either its shallowness or its high
temperatures and salinities, will die as soon as they reach the steep walls leading towards
the narrow and shallow entrance into this Gulf. (Fig. 5).
N
25·
20·
15"
10·
s·
o·
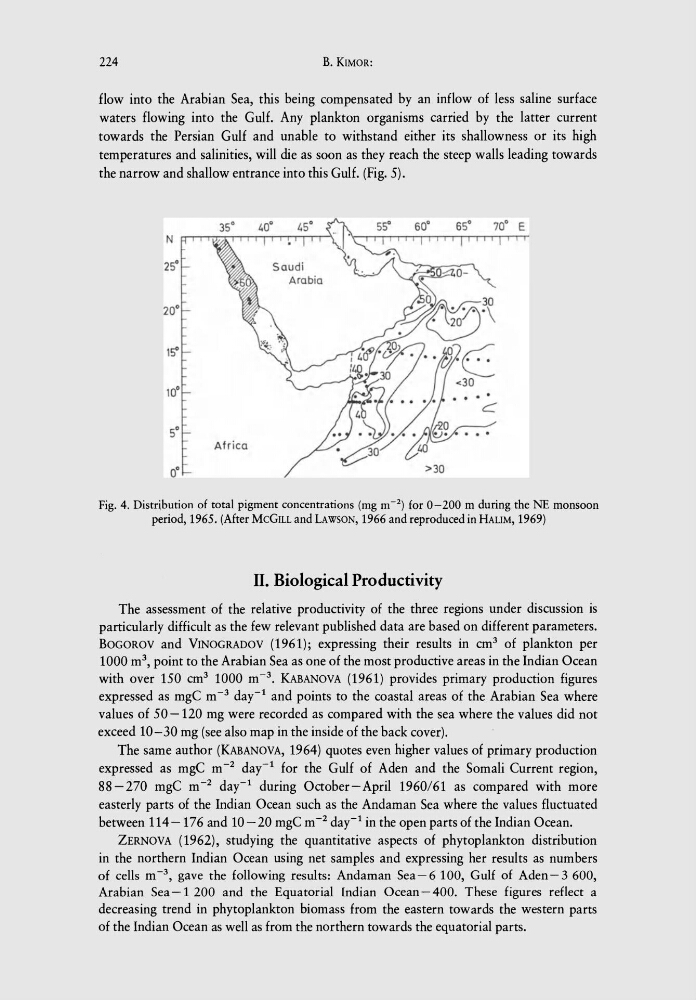
Fig. 4. Distribution of total pigment concentrations (mg m- 2 ) for 0-200 m during the NE monsoon
period, 1965. (After MCGILL and LAWSON, 1966 and reproduced in HALIM, 1969)
II. Biological Productivity
The assessment of the relative productivity of the three regions under discussion is
particularly difficult as the few relevant published data are based on different parameters.
BOGOROV and VINOGRADOV (1961); expressing their results in cm 3 of plankton per
1000 m 3 , point to the Arabian Sea as one of the most productive areas in the Indian Ocean
with over 150 cm 3 1000 m- 3 • KABANOVA (1961) provides primary production figures
expressed as mgC m- 3 day-l and points to the coastal areas of the Arabian Sea where
values of 50 -120 mg were recorded as compared with the sea where the values did not
exceed 10-30 mg (see also map in the inside of the back cover).
The same author (KABANoVA, 1964) quotes even higher values of primary production
expressed as mgC m- 2 day-l for the Gulf of Aden and the Somali Current region,
88-270 mgC m- 2 day-l during October-April 1960161 as compared with more
easterly parts of the Indian Ocean such as the Andaman Sea where the values fluctuated
between 114-176 and 10- 20 mgC m- 2 day-l in the open parts of the Indian Ocean.
ZERNOVA (1962), studying the quantitative aspects of phytoplankton distribution
in the northern Indian Ocean using net samples and expressing her results as numbers
of cells m- 3 , gave the following results: Andaman Sea-6 100, Gulf of Aden-3 600,
Arabian Sea -1 200 and the Equatorial Indian Ocean - 400. These figures reflect a
decreasing trend in phytoplankton biomass from the eastern towards the western parts
of the Indian Ocean as well as from the northern towards the equatorial parts.
B. KIMOR:
flow into the Arabian Sea, this being compensated by an inflow of less saline surface
waters flowing into the Gulf. Any plankton organisms carried by the latter current
towards the Persian Gulf and unable to withstand either its shallowness or its high
temperatures and salinities, will die as soon as they reach the steep walls leading towards
the narrow and shallow entrance into this Gulf. (Fig. 5).
N
25·
20·
15"
10·
s·
o·
Fig. 4. Distribution of total pigment concentrations (mg m- 2 ) for 0-200 m during the NE monsoon
period, 1965. (After MCGILL and LAWSON, 1966 and reproduced in HALIM, 1969)
II. Biological Productivity
The assessment of the relative productivity of the three regions under discussion is
particularly difficult as the few relevant published data are based on different parameters.
BOGOROV and VINOGRADOV (1961); expressing their results in cm 3 of plankton per
1000 m 3 , point to the Arabian Sea as one of the most productive areas in the Indian Ocean
with over 150 cm 3 1000 m- 3 • KABANOVA (1961) provides primary production figures
expressed as mgC m- 3 day-l and points to the coastal areas of the Arabian Sea where
values of 50 -120 mg were recorded as compared with the sea where the values did not
exceed 10-30 mg (see also map in the inside of the back cover).
The same author (KABANoVA, 1964) quotes even higher values of primary production
expressed as mgC m- 2 day-l for the Gulf of Aden and the Somali Current region,
88-270 mgC m- 2 day-l during October-April 1960161 as compared with more
easterly parts of the Indian Ocean such as the Andaman Sea where the values fluctuated
between 114-176 and 10- 20 mgC m- 2 day-l in the open parts of the Indian Ocean.
ZERNOVA (1962), studying the quantitative aspects of phytoplankton distribution
in the northern Indian Ocean using net samples and expressing her results as numbers
of cells m- 3 , gave the following results: Andaman Sea-6 100, Gulf of Aden-3 600,
Arabian Sea -1 200 and the Equatorial Indian Ocean - 400. These figures reflect a
decreasing trend in phytoplankton biomass from the eastern towards the western parts
of the Indian Ocean as well as from the northern towards the equatorial parts.