

140
S. Z. EL-SAYED and H. R. lITIS:
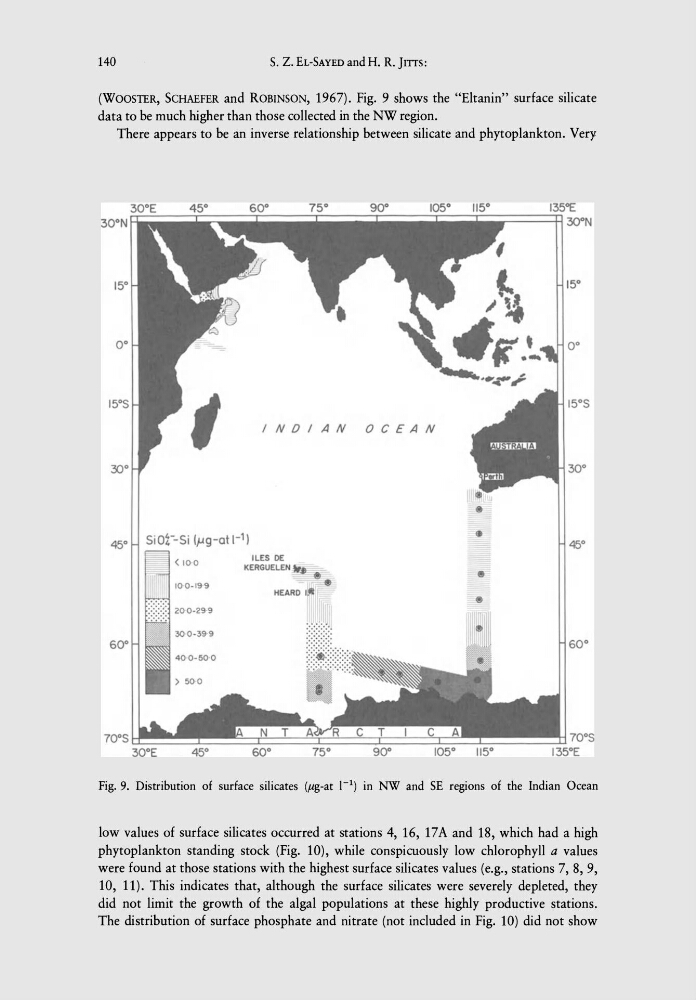
(WOOSTER, SCHAEFER and ROBINSON, 1967). Fig. 9 shows the "Eltanin" surface silicate
data to be much higher than those collected in the NW region.
There appears to be an inverse relationship between silicate and phytoplankton. Very
INDIAN
OCEAN
ILES DE
KERGUELEN_e.
•
•
II
Fig. 9. Distribution of surface silicates (,ug-at I-i) in NW and SE regions of the Indian Ocean
low values of surface silicates occurred at stations 4, 16, 17A and 18, which had a high
phytoplankton standing stock (Fig. 10), while conspicuously low chlorophyll a values
were found at those stations with the highest surface silicates values (e.g., stations 7, 8, 9,
10, 11). This indicates that, although the surface silicates were severely depleted, they
did not limit the growth of the algal populations at these highly productive stations.
The distribution of surface phosphate and nitrate (not included in Fig. 10) did not show
S. Z. EL-SAYED and H. R. lITIS:
(WOOSTER, SCHAEFER and ROBINSON, 1967). Fig. 9 shows the "Eltanin" surface silicate
data to be much higher than those collected in the NW region.
There appears to be an inverse relationship between silicate and phytoplankton. Very
INDIAN
OCEAN
ILES DE
KERGUELEN_e.
•
•
II
Fig. 9. Distribution of surface silicates (,ug-at I-i) in NW and SE regions of the Indian Ocean
low values of surface silicates occurred at stations 4, 16, 17A and 18, which had a high
phytoplankton standing stock (Fig. 10), while conspicuously low chlorophyll a values
were found at those stations with the highest surface silicates values (e.g., stations 7, 8, 9,
10, 11). This indicates that, although the surface silicates were severely depleted, they
did not limit the growth of the algal populations at these highly productive stations.
The distribution of surface phosphate and nitrate (not included in Fig. 10) did not show