

9 Genomic Techniques and How to Apply Them to Marine Questions
363
0
10000
20000
30000
40000
50000
60000
0
10000 20000 30000 40000 50000 60000
Cy5 − Cy5B
Cy3 − Cy3B
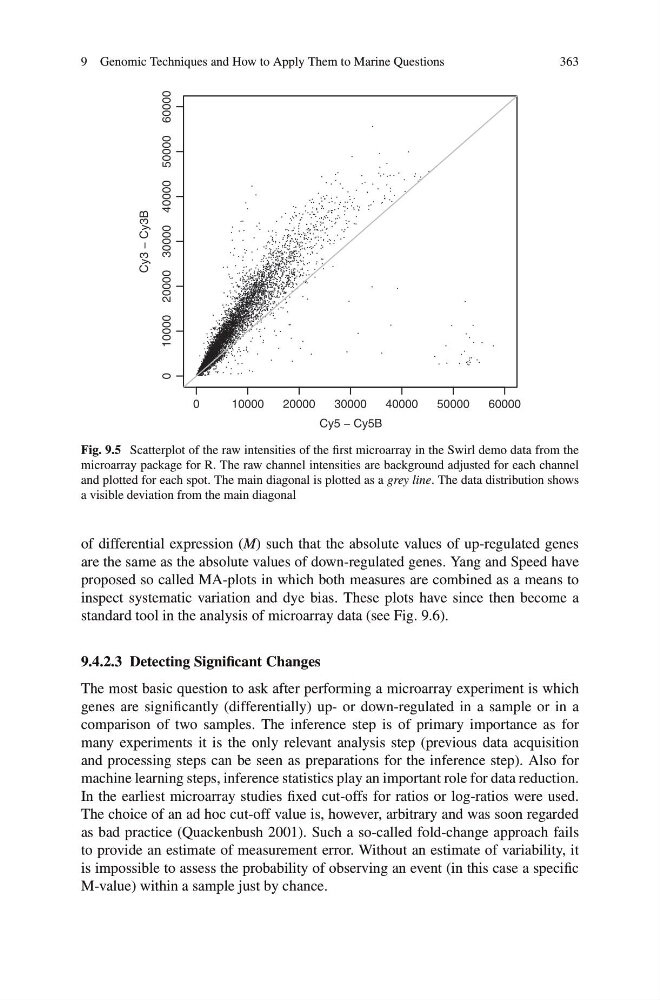
Fig. 9.5 Scatterplot of the raw intensities of the first microarray in the Swirl demo data from the
microarray package for R. The raw channel intensities are background adjusted for each channel
and plotted for each spot. The main diagonal is plotted as a grey line. The data distribution shows
a visible deviation from the main diagonal
of differential expression (M) such that the absolute values of up-regulated genes
are the same as the absolute values of down-regulated genes. Yang and Speed have
proposed so called MA-plots in which both measures are combined as a means to
inspect systematic variation and dye bias. These plots have since then become a
standard tool in the analysis of microarray data (see Fig. 9.6).
9.4.2.3 Detecting Significant Changes
The most basic question to ask after performing a microarray experiment is which
genes are significantly (differentially) up- or down-regulated in a sample or in a
comparison of two samples. The inference step is of primary importance as for
many experiments it is the only relevant analysis step (previous data acquisition
and processing steps can be seen as preparations for the inference step). Also for
machine learning steps, inference statistics play an important role for data reduction.
In the earliest microarray studies fixed cut-offs for ratios or log-ratios were used.
The choice of an ad hoc cut-off value is, however, arbitrary and was soon regarded
as bad practice (Quackenbush 2001). Such a so-called fold-change approach fails
to provide an estimate of measurement error. Without an estimate of variability, it
is impossible to assess the probability of observing an event (in this case a specific
M-value) within a sample just by chance.
363
0
10000
20000
30000
40000
50000
60000
0
10000 20000 30000 40000 50000 60000
Cy5 − Cy5B
Cy3 − Cy3B
Fig. 9.5 Scatterplot of the raw intensities of the first microarray in the Swirl demo data from the
microarray package for R. The raw channel intensities are background adjusted for each channel
and plotted for each spot. The main diagonal is plotted as a grey line. The data distribution shows
a visible deviation from the main diagonal
of differential expression (M) such that the absolute values of up-regulated genes
are the same as the absolute values of down-regulated genes. Yang and Speed have
proposed so called MA-plots in which both measures are combined as a means to
inspect systematic variation and dye bias. These plots have since then become a
standard tool in the analysis of microarray data (see Fig. 9.6).
9.4.2.3 Detecting Significant Changes
The most basic question to ask after performing a microarray experiment is which
genes are significantly (differentially) up- or down-regulated in a sample or in a
comparison of two samples. The inference step is of primary importance as for
many experiments it is the only relevant analysis step (previous data acquisition
and processing steps can be seen as preparations for the inference step). Also for
machine learning steps, inference statistics play an important role for data reduction.
In the earliest microarray studies fixed cut-offs for ratios or log-ratios were used.
The choice of an ad hoc cut-off value is, however, arbitrary and was soon regarded
as bad practice (Quackenbush 2001). Such a so-called fold-change approach fails
to provide an estimate of measurement error. Without an estimate of variability, it
is impossible to assess the probability of observing an event (in this case a specific
M-value) within a sample just by chance.