

364
V. Mittard-Runte et al.
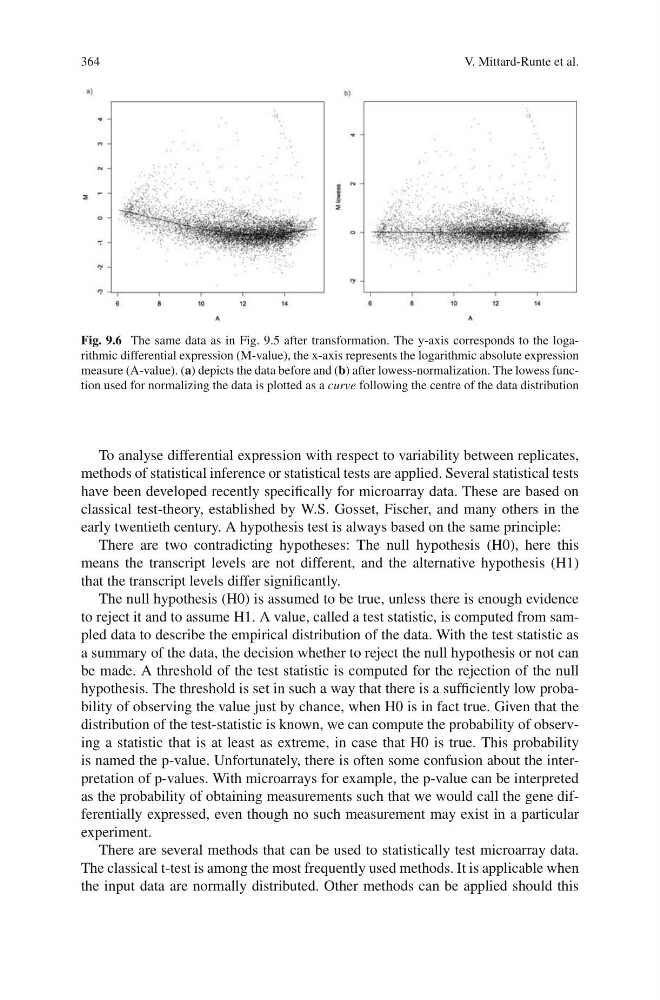
Fig. 9.6 The same data as in Fig. 9.5 after transformation. The y-axis corresponds to the logarithmic differential expression (M-value), the x-axis represents the logarithmic absolute expression
measure (A-value). (a) depicts the data before and (b) after lowess-normalization. The lowess function used for normalizing the data is plotted as a curve following the centre of the data distribution
To analyse differential expression with respect to variability between replicates,
methods of statistical inference or statistical tests are applied. Several statistical tests
have been developed recently specifically for microarray data. These are based on
classical test-theory, established by W.S. Gosset, Fischer, and many others in the
early twentieth century. A hypothesis test is always based on the same principle:
There are two contradicting hypotheses: The null hypothesis (H0), here this
means the transcript levels are not different, and the alternative hypothesis (H1)
that the transcript levels differ significantly.
The null hypothesis (H0) is assumed to be true, unless there is enough evidence
to reject it and to assume H1. A value, called a test statistic, is computed from sampled data to describe the empirical distribution of the data. With the test statistic as
a summary of the data, the decision whether to reject the null hypothesis or not can
be made. A threshold of the test statistic is computed for the rejection of the null
hypothesis. The threshold is set in such a way that there is a sufficiently low probability of observing the value just by chance, when H0 is in fact true. Given that the
distribution of the test-statistic is known, we can compute the probability of observing a statistic that is at least as extreme, in case that H0 is true. This probability
is named the p-value. Unfortunately, there is often some confusion about the interpretation of p-values. With microarrays for example, the p-value can be interpreted
as the probability of obtaining measurements such that we would call the gene differentially expressed, even though no such measurement may exist in a particular
experiment.
There are several methods that can be used to statistically test microarray data.
The classical t-test is among the most frequently used methods. It is applicable when
the input data are normally distributed. Other methods can be applied should this
V. Mittard-Runte et al.
Fig. 9.6 The same data as in Fig. 9.5 after transformation. The y-axis corresponds to the logarithmic differential expression (M-value), the x-axis represents the logarithmic absolute expression
measure (A-value). (a) depicts the data before and (b) after lowess-normalization. The lowess function used for normalizing the data is plotted as a curve following the centre of the data distribution
To analyse differential expression with respect to variability between replicates,
methods of statistical inference or statistical tests are applied. Several statistical tests
have been developed recently specifically for microarray data. These are based on
classical test-theory, established by W.S. Gosset, Fischer, and many others in the
early twentieth century. A hypothesis test is always based on the same principle:
There are two contradicting hypotheses: The null hypothesis (H0), here this
means the transcript levels are not different, and the alternative hypothesis (H1)
that the transcript levels differ significantly.
The null hypothesis (H0) is assumed to be true, unless there is enough evidence
to reject it and to assume H1. A value, called a test statistic, is computed from sampled data to describe the empirical distribution of the data. With the test statistic as
a summary of the data, the decision whether to reject the null hypothesis or not can
be made. A threshold of the test statistic is computed for the rejection of the null
hypothesis. The threshold is set in such a way that there is a sufficiently low probability of observing the value just by chance, when H0 is in fact true. Given that the
distribution of the test-statistic is known, we can compute the probability of observing a statistic that is at least as extreme, in case that H0 is true. This probability
is named the p-value. Unfortunately, there is often some confusion about the interpretation of p-values. With microarrays for example, the p-value can be interpreted
as the probability of obtaining measurements such that we would call the gene differentially expressed, even though no such measurement may exist in a particular
experiment.
There are several methods that can be used to statistically test microarray data.
The classical t-test is among the most frequently used methods. It is applicable when
the input data are normally distributed. Other methods can be applied should this