

362
V. Mittard-Runte et al.
using a master grid for semi-automatic segmentation of spot images. There are also
algorithms that can do a fully automated segmentation, but special care should be
taken. Errors during segmentation can lead to erroneous results, because missing the
correct location of a number of features can lead to measurements being assigned to
the wrong feature.
In the next step, the image analysis software computes the intensity for each
feature, and statistics such as measures of variation and background estimates are
usually also calculated at the same time. Most software adds measures of signal
quality. These are often called flags and can be used to filter out spots with low
signal intensity or irregular shape. Automatic flags should be treated with care, as it
is often not clear how these measures are derived, as each software does the analysis
in a different way. If in doubt, it might be preferable to ignore flags and leave the
removal for later stages in the analysis.
9.4.2.2 Normalization
To answer an experimental question, the various measurements coming from the
image analysis need to be condensed to a single value or at least a lower number of
values describing the intensity or the differential intensity of a feature.
The aim of applying normalization to microarray data is to make the data from
different microarrays within an experiment comparable. Therefore, it is necessary
to remove systematic bias from the datasets (Quackenbush 2002). A systematic bias
in the data might originate from differences in RNA concentrations between samples, differences in scanner settings, and differences in the labelling, bleaching, and
detection behaviour of the dyes. From an inspection of technical replicate arrays
hybridized with the same labelled extract, it can be concluded that scanner settings
also contribute to a large degree to the between-array bias. Cyanin-dyes 3 and 5
(Cy3 and Cy5) are currently the most frequently used fluorescent markers used for
two-channel microarrays. These dyes emit different light intensities with respect to
the number of hybridized target and this relation is not linear. This can lead to nonlinear distortions, which can be visualised in scatter plots of the measured intensities
of two channels (see Fig. 9.5).
Yang and Speed (2002) have developed a normalization method that uses a
so called scatterplot smoothing function. They also propose a special logarithmic
transformation of the raw microarray intensities that is suitable for plotting differential expression on a log-scale. This transformation maps the optionally background
subtracted intensity values to a log-ratio (M) and a log-intensity measure (A):
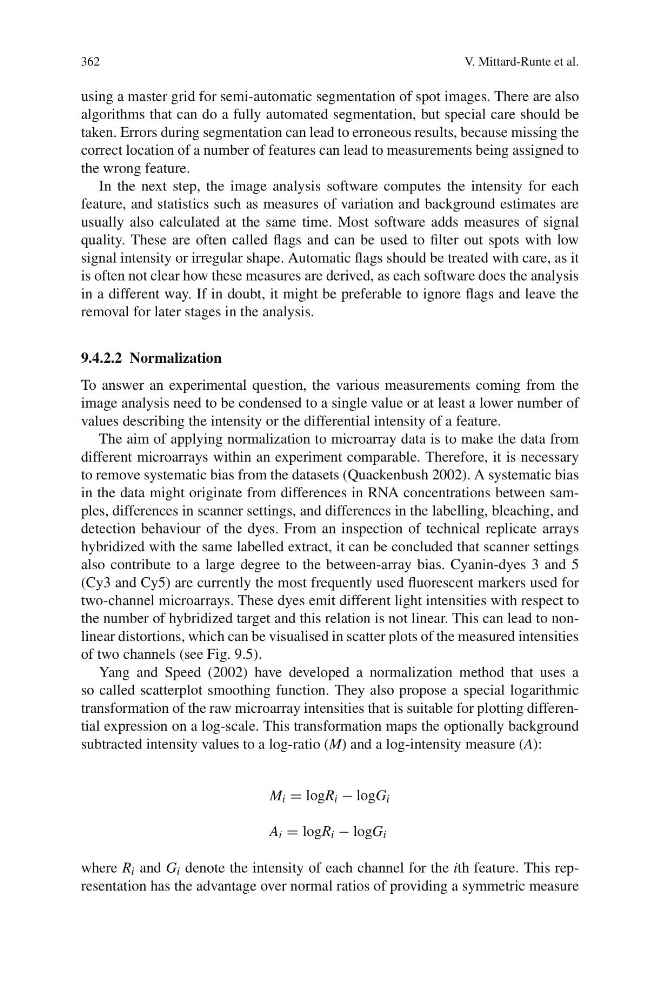
M i = logR i − logG i
A i = logR i − logG i
where R i and G i denote the intensity of each channel for the ith feature. This representation has the advantage over normal ratios of providing a symmetric measure
V. Mittard-Runte et al.
using a master grid for semi-automatic segmentation of spot images. There are also
algorithms that can do a fully automated segmentation, but special care should be
taken. Errors during segmentation can lead to erroneous results, because missing the
correct location of a number of features can lead to measurements being assigned to
the wrong feature.
In the next step, the image analysis software computes the intensity for each
feature, and statistics such as measures of variation and background estimates are
usually also calculated at the same time. Most software adds measures of signal
quality. These are often called flags and can be used to filter out spots with low
signal intensity or irregular shape. Automatic flags should be treated with care, as it
is often not clear how these measures are derived, as each software does the analysis
in a different way. If in doubt, it might be preferable to ignore flags and leave the
removal for later stages in the analysis.
9.4.2.2 Normalization
To answer an experimental question, the various measurements coming from the
image analysis need to be condensed to a single value or at least a lower number of
values describing the intensity or the differential intensity of a feature.
The aim of applying normalization to microarray data is to make the data from
different microarrays within an experiment comparable. Therefore, it is necessary
to remove systematic bias from the datasets (Quackenbush 2002). A systematic bias
in the data might originate from differences in RNA concentrations between samples, differences in scanner settings, and differences in the labelling, bleaching, and
detection behaviour of the dyes. From an inspection of technical replicate arrays
hybridized with the same labelled extract, it can be concluded that scanner settings
also contribute to a large degree to the between-array bias. Cyanin-dyes 3 and 5
(Cy3 and Cy5) are currently the most frequently used fluorescent markers used for
two-channel microarrays. These dyes emit different light intensities with respect to
the number of hybridized target and this relation is not linear. This can lead to nonlinear distortions, which can be visualised in scatter plots of the measured intensities
of two channels (see Fig. 9.5).
Yang and Speed (2002) have developed a normalization method that uses a
so called scatterplot smoothing function. They also propose a special logarithmic
transformation of the raw microarray intensities that is suitable for plotting differential expression on a log-scale. This transformation maps the optionally background
subtracted intensity values to a log-ratio (M) and a log-intensity measure (A):
M i = logR i − logG i
A i = logR i − logG i
where R i and G i denote the intensity of each channel for the ith feature. This representation has the advantage over normal ratios of providing a symmetric measure