

Bacterio Plankton
81
J{l
2{l
TtJ
2{l
tl
{'!oJ
~-----------------------------------'A,% ~/Bp
/
.JtJ T, {l
/
If'
u-_ _ A..::g_-o _ _ _ _ "'/~
25 fJ,.f
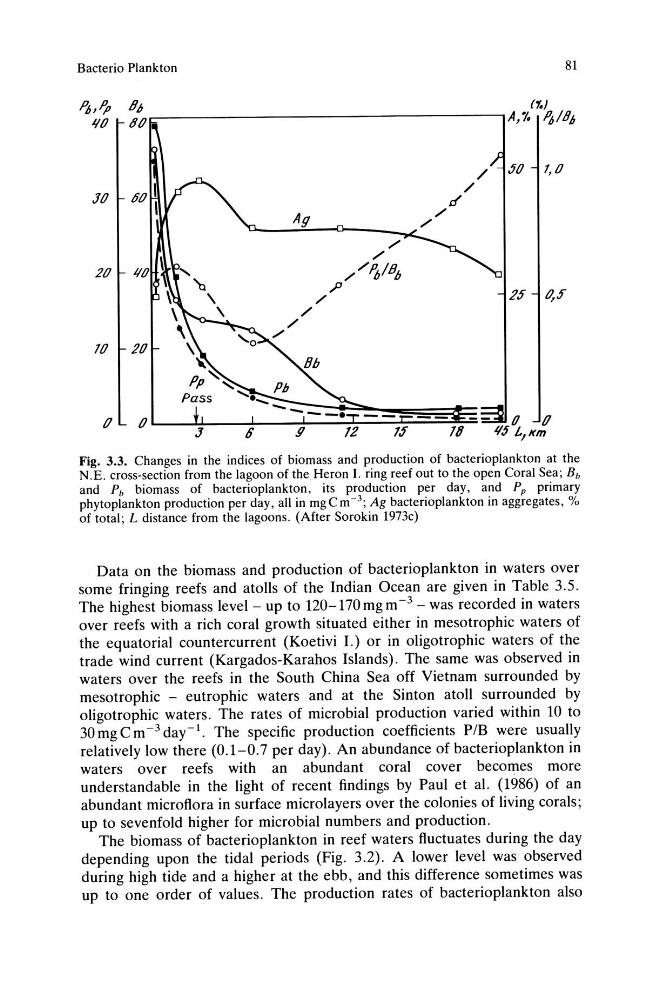
Fig. 3.3. Changes in the indices of biomass and production of bacterioplankton at the
N.E. cross-section from the lagoon of the Heron I. ring reef out to the open Coral Sea; Bb
and Pb biomass of bacterioplankton, its production per day, and Pp primary
phytoplankton production per day, all in mg C m -3; Ag bacterioplankton in aggregates, %
of total; L distance from the lagoons. (After Sorokin 1973c)
Data on the biomass and production of bacterioplankton in waters over
some fringing reefs and atolls of the Indian Ocean are given in Table 3.5.
The highest biomass level - up to 120-170 mg m -3 - was recorded in waters
over reefs with a rich coral growth situated either in meso trophic waters of
the equatorial countercurrent (Koetivi I.) or in oligotrophic waters of the
trade wind current (Kargados-Karahos Islands). The same was observed in
waters over the reefs in the South China Sea off Vietnam surrounded by
mesotrophic - eutrophic waters and at the Sinton atoll surrounded by
oligotrophic waters. The rates of microbial production varied within 10 to
30mgCm- 3 day-'. The specific production coefficients PIB were usually
relatively low there (0.1-0.7 per day). An abundance of bacterioplankton in
waters over reefs with an abundant coral cover becomes more
understandable in the light of recent findings by Paul et al. (1986) of an
abundant microflora in surface microlayers over the colonies of living corals;
up to sevenfold higher for microbial numbers and production.
The biomass of bacterioplankton in reef waters fluctuates during the day
depending upon the tidal periods (Fig. 3.2). A lower level was observed
during high tide and a higher at the ebb, and this difference sometimes was
up to one order of values. The production rates of bacterioplankton also
81
J{l
2{l
TtJ
2{l
tl
{'!oJ
~-----------------------------------'A,% ~/Bp
/
.JtJ T, {l
/
If'
u-_ _ A..::g_-o _ _ _ _ "'/~
25 fJ,.f
Fig. 3.3. Changes in the indices of biomass and production of bacterioplankton at the
N.E. cross-section from the lagoon of the Heron I. ring reef out to the open Coral Sea; Bb
and Pb biomass of bacterioplankton, its production per day, and Pp primary
phytoplankton production per day, all in mg C m -3; Ag bacterioplankton in aggregates, %
of total; L distance from the lagoons. (After Sorokin 1973c)
Data on the biomass and production of bacterioplankton in waters over
some fringing reefs and atolls of the Indian Ocean are given in Table 3.5.
The highest biomass level - up to 120-170 mg m -3 - was recorded in waters
over reefs with a rich coral growth situated either in meso trophic waters of
the equatorial countercurrent (Koetivi I.) or in oligotrophic waters of the
trade wind current (Kargados-Karahos Islands). The same was observed in
waters over the reefs in the South China Sea off Vietnam surrounded by
mesotrophic - eutrophic waters and at the Sinton atoll surrounded by
oligotrophic waters. The rates of microbial production varied within 10 to
30mgCm- 3 day-'. The specific production coefficients PIB were usually
relatively low there (0.1-0.7 per day). An abundance of bacterioplankton in
waters over reefs with an abundant coral cover becomes more
understandable in the light of recent findings by Paul et al. (1986) of an
abundant microflora in surface microlayers over the colonies of living corals;
up to sevenfold higher for microbial numbers and production.
The biomass of bacterioplankton in reef waters fluctuates during the day
depending upon the tidal periods (Fig. 3.2). A lower level was observed
during high tide and a higher at the ebb, and this difference sometimes was
up to one order of values. The production rates of bacterioplankton also