

80
Plankton in Coral-Reef Waters
and up the outer reef edges (Tables 3.1-3.3; Fig. 3.1). The coefficients of
specific production (P/B) per day in the reef waters were on the average
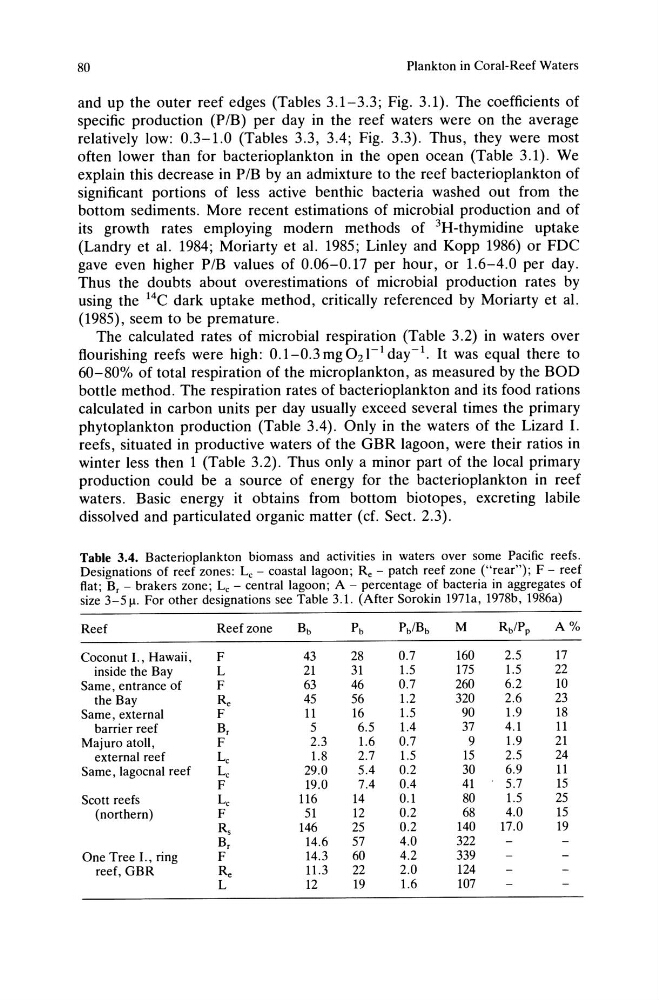
relatively low: 0.3-1.0 (Tables 3.3, 3.4; Fig. 3.3). Thus, they were most
often lower than for bacterioplankton in the open ocean (Table 3.1). We
explain this decrease in P IB by an admixture to the reef bacterioplankton of
significant portions of less active benthic bacteria washed out from the
bottom sediments. More recent estimations of microbial production and of
its growth rates employing modern methods of 3H-thymidine uptake
(Landry et al. 1984; Moriarty et al. 1985; Linley and Kopp 1986) or FDC
gave even higher PIB values of 0.06-0.17 per hour, or 1.6-4.0 per day.
Thus the doubts about overestimations of microbial production rates by
using the 14C dark uptake method, critically referenced by Moriarty et al.
(1985), seem to be premature.
The calculated rates of microbial respiration (Table 3.2) in waters over
flourishing reefs were high: 0.1-0.3 mg 0 2 1- 1 day-I. It was equal there to
60-80% of total respiration of the microplankton, as measured by the BOD
bottle method. The respiration rates of bacterioplankton and its food rations
calculated in carbon units per day usually exceed several times the primary
phytoplankton production (Table 3.4). Only in the waters of the Lizard I.
reefs, situated in productive waters of the GBR lagoon, were their ratios in
winter less then 1 (Table 3.2). Thus only a minor part of the local primary
production could be a source of energy for the bacterioplankton in reef
waters. Basic energy it obtains from bottom biotopes, excreting labile
dissolved and particulated organic matter (cf. Sect. 2.3).
Table 3.4. Bacterioplankton biomass and activities in waters over some Pacific reefs.
Designations of reef zones: Lc - coastal lagoon; Re - patch reef zone ("rear"); F - reef
fiat; B, - brakers zone; Lc - central lagoon; A - percentage of bacteria in aggregates of
size 3-511. For other designations see Table 3.1. (After Sorokin 1971a, 1978b, 1986a)
Reef
Reef zone
Bb
Pb
Pb/Bb
M
Rb/Pp
A%
Coconut I., Hawaii,
F
43
28
0.7
160
2.5
17
inside the Bay
L
21
31
1.5
175
1.5
22
Same, entrance of
F
63
46
0.7
260
6.2
10
the Bay
Re
45
56
1.2
320
2.6
23
Same, external
F
11
16
1.5
90
1.9
18
barrier reef
B,
5
6.5
1.4
37
4.1
11
Majuro atoll,
F
2.3
1.6
0.7
9
1.9
21
external reef
Lc
1.8
2.7
1.5
15
2.5
24
Same, lagocnal reef
Lc
29.0
5.4
0.2
30
6.9
11
F
19.0
7.4
0.4
41
5.7
15
Scott reefs
Lc
116
14
0.1
80
1.5
25
(northern)
F
51
12
0.2
68
4.0
15
Rs
146
25
0.2
140
17.0
19
B,
14.6
57
4.0
322
One Tree I., ring
F
14.3
60
4.2
339
reef, GBR
Re
11.3
22
2.0
124
L
12
19
1.6
107
Plankton in Coral-Reef Waters
and up the outer reef edges (Tables 3.1-3.3; Fig. 3.1). The coefficients of
specific production (P/B) per day in the reef waters were on the average
relatively low: 0.3-1.0 (Tables 3.3, 3.4; Fig. 3.3). Thus, they were most
often lower than for bacterioplankton in the open ocean (Table 3.1). We
explain this decrease in P IB by an admixture to the reef bacterioplankton of
significant portions of less active benthic bacteria washed out from the
bottom sediments. More recent estimations of microbial production and of
its growth rates employing modern methods of 3H-thymidine uptake
(Landry et al. 1984; Moriarty et al. 1985; Linley and Kopp 1986) or FDC
gave even higher PIB values of 0.06-0.17 per hour, or 1.6-4.0 per day.
Thus the doubts about overestimations of microbial production rates by
using the 14C dark uptake method, critically referenced by Moriarty et al.
(1985), seem to be premature.
The calculated rates of microbial respiration (Table 3.2) in waters over
flourishing reefs were high: 0.1-0.3 mg 0 2 1- 1 day-I. It was equal there to
60-80% of total respiration of the microplankton, as measured by the BOD
bottle method. The respiration rates of bacterioplankton and its food rations
calculated in carbon units per day usually exceed several times the primary
phytoplankton production (Table 3.4). Only in the waters of the Lizard I.
reefs, situated in productive waters of the GBR lagoon, were their ratios in
winter less then 1 (Table 3.2). Thus only a minor part of the local primary
production could be a source of energy for the bacterioplankton in reef
waters. Basic energy it obtains from bottom biotopes, excreting labile
dissolved and particulated organic matter (cf. Sect. 2.3).
Table 3.4. Bacterioplankton biomass and activities in waters over some Pacific reefs.
Designations of reef zones: Lc - coastal lagoon; Re - patch reef zone ("rear"); F - reef
fiat; B, - brakers zone; Lc - central lagoon; A - percentage of bacteria in aggregates of
size 3-511. For other designations see Table 3.1. (After Sorokin 1971a, 1978b, 1986a)
Reef
Reef zone
Bb
Pb
Pb/Bb
M
Rb/Pp
A%
Coconut I., Hawaii,
F
43
28
0.7
160
2.5
17
inside the Bay
L
21
31
1.5
175
1.5
22
Same, entrance of
F
63
46
0.7
260
6.2
10
the Bay
Re
45
56
1.2
320
2.6
23
Same, external
F
11
16
1.5
90
1.9
18
barrier reef
B,
5
6.5
1.4
37
4.1
11
Majuro atoll,
F
2.3
1.6
0.7
9
1.9
21
external reef
Lc
1.8
2.7
1.5
15
2.5
24
Same, lagocnal reef
Lc
29.0
5.4
0.2
30
6.9
11
F
19.0
7.4
0.4
41
5.7
15
Scott reefs
Lc
116
14
0.1
80
1.5
25
(northern)
F
51
12
0.2
68
4.0
15
Rs
146
25
0.2
140
17.0
19
B,
14.6
57
4.0
322
One Tree I., ring
F
14.3
60
4.2
339
reef, GBR
Re
11.3
22
2.0
124
L
12
19
1.6
107