

Biogeochemical Metabolism and Energy Flows in Reef Ecosystems
0800
JOOO
21100
Time oj the dUj, h
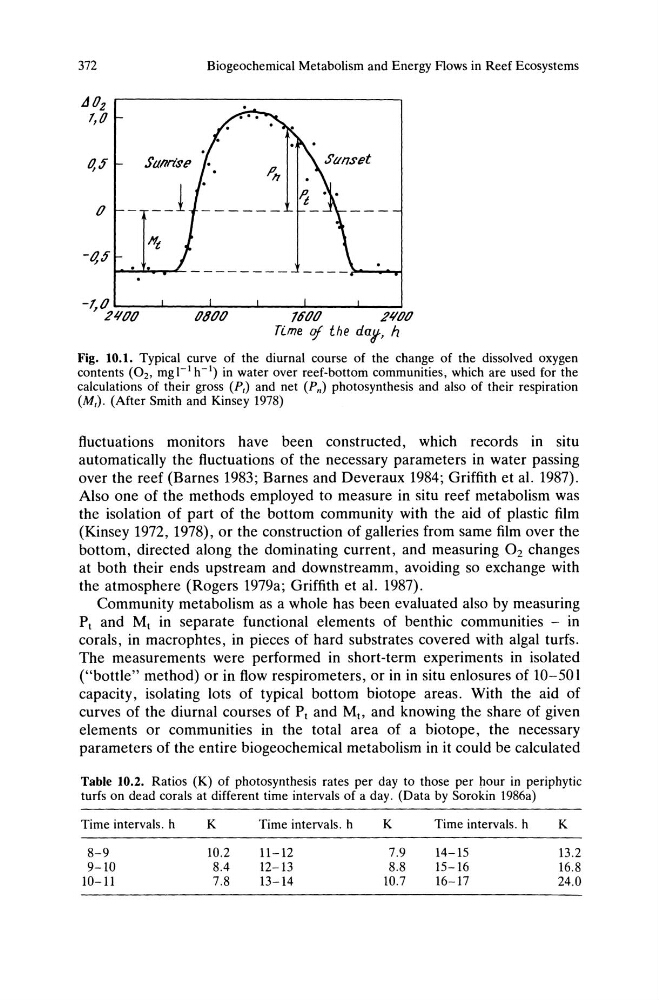
Fig. 10.1. Typical curve of the diurnal course of the change of the dissolved oxygen
contents (02 , mgl-1h- 1 ) in water over reef-bottom communities, which are used for the
calculations of their gross (P,) and net (Pn) photosynthesis and also of their respiration
(M,). (After Smith and Kinsey 1978)
fluctuations monitors have been constructed, which records in situ
automatically the fluctuations of the necessary parameters in water passing
over the reef (Barnes 1983; Barnes and Deveraux 1984; Griffith et al. 1987).
Also one of the methods employed to measure in situ reef metabolism was
the isolation of part of the bottom community with the aid of plastic film
(Kinsey 1972, 1978), or the construction of galleries from same film over the
bottom, directed along the dominating current, and measuring O2 changes
at both their ends upstream and downstreamm, avoiding so exchange with
the atmosphere (Rogers 1979a; Griffith et al. 1987).
Community metabolism as a whole has been evaluated also by measuring
PI and Mt in separate functional elements of benthic communities - in
corals, in macrophtes, in pieces of hard substrates covered with algal turfs.
The measurements were performed in short-term experiments in isolated
("bottle" method) or in flow respirometers, or in in situ enlosures of 10-50 I
capacity, isolating lots of typical bottom biotope areas. With the aid of
curves of the diurnal courses of Pt and MI , and knowing the share of given
elements or communities in the total area of a biotope, the necessary
parameters of the entire biogeochemical metabolism in it could be calculated
Table 10.2. Ratios (K) of photosynthesis rates per day to those per hour in periphytic
turfs on dead corals at different time intervals of a day. (Data by Sorokin 1986a)
Time intervals. h
8-9
9-10
10-11
K
10.2
8.4
7.8
Time intervals. h
11-12
12-13
13-14
K
7.9
8.8
10.7
Time intervals. h
14-15
15-16
16-17
K
13.2
16.8
24.0
0800
JOOO
21100
Time oj the dUj, h
Fig. 10.1. Typical curve of the diurnal course of the change of the dissolved oxygen
contents (02 , mgl-1h- 1 ) in water over reef-bottom communities, which are used for the
calculations of their gross (P,) and net (Pn) photosynthesis and also of their respiration
(M,). (After Smith and Kinsey 1978)
fluctuations monitors have been constructed, which records in situ
automatically the fluctuations of the necessary parameters in water passing
over the reef (Barnes 1983; Barnes and Deveraux 1984; Griffith et al. 1987).
Also one of the methods employed to measure in situ reef metabolism was
the isolation of part of the bottom community with the aid of plastic film
(Kinsey 1972, 1978), or the construction of galleries from same film over the
bottom, directed along the dominating current, and measuring O2 changes
at both their ends upstream and downstreamm, avoiding so exchange with
the atmosphere (Rogers 1979a; Griffith et al. 1987).
Community metabolism as a whole has been evaluated also by measuring
PI and Mt in separate functional elements of benthic communities - in
corals, in macrophtes, in pieces of hard substrates covered with algal turfs.
The measurements were performed in short-term experiments in isolated
("bottle" method) or in flow respirometers, or in in situ enlosures of 10-50 I
capacity, isolating lots of typical bottom biotope areas. With the aid of
curves of the diurnal courses of Pt and MI , and knowing the share of given
elements or communities in the total area of a biotope, the necessary
parameters of the entire biogeochemical metabolism in it could be calculated
Table 10.2. Ratios (K) of photosynthesis rates per day to those per hour in periphytic
turfs on dead corals at different time intervals of a day. (Data by Sorokin 1986a)
Time intervals. h
8-9
9-10
10-11
K
10.2
8.4
7.8
Time intervals. h
11-12
12-13
13-14
K
7.9
8.8
10.7
Time intervals. h
14-15
15-16
16-17
K
13.2
16.8
24.0