

Biogeochemical Metabolism of Organic Matter
373
(Marsh 1970; Sorokin 1971b, 1986b; Quasim et al. 1972; Sournia 1976b;
Propp et al. 1983; Griffith et al. 1987). To measure the rates of
photosynthesis, besides the oxygen method the radiocarbon method was
also used in this way, taking into account that it gives them close to the net
production P n (Sorokin 1973c, 1986a; Bittaker and Iverson 1976). To study
reef metabolism microcosms were also constructed, which included basic
elements of bottom biotopes and had a volume of several cubic meters
(Adey 1983; Griffith et al. 1987). The coefficients, necessary for
recalculations of the gross photosynthesis values, measured during different
periods of the day per whole day in periphytic turfs over dead corals, are
given in Table 10.2.
High rates of biogeochemical metabolism in reef biotopes result in
extremely large amplitudes in diurnal fluctuations of O2, CO2 and pH in
waters over the reef. The amplitude of fluctuations of dissolved O2 could
reach 5-8 mg 0 2 1+1. In Fig. 10.1 an example of the diurnal course of rates
of changes in O 2 content (8 02h-1) in water is given, which has been used
for calculations of PI' Pn and MI values per day. In Fig. 10.3 typical
measurement results of O2 content in water over the reef at different times
of the day are shown. The rate of visible increase in O2 content in water,
which is proportional to the net photosynthesis (P n) at midday, ranges
usually from 0.5 to 1.5mg021-1h-l. The rates of decrease at night,
proportional to M I , are expressed by the values 0.2 to 1.5mg021-1h-l at
verage depths of 0.5-1.5 m. The largest fluctuations take place at shallows
over the reef flat and over patch reefs (Fig. 10.4). The corresponding diurnal
fluctuations of alkalinity in such biotopes range usually between 100-300llg
equivalents 1-1, and the shifts of pH - 1 to 2 units - from 7.5 to 8.5-9.5,
caused by processes of photosynthesis, respiration and calcification (Kinsey
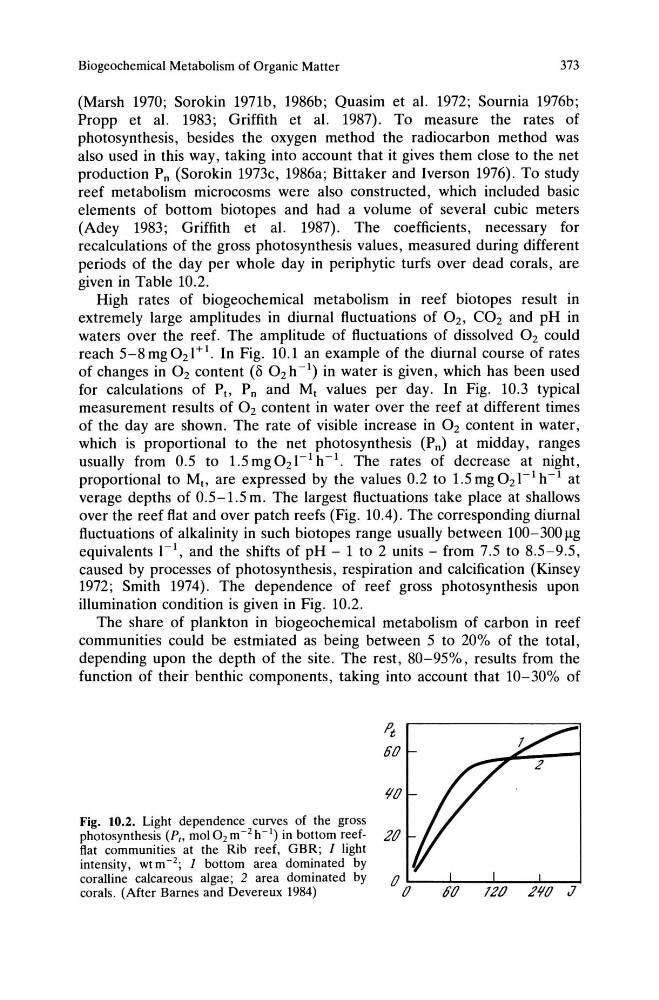
1972; Smith 1974). The dependence of reef gross photosynthesis upon
illumination condition is given in Fig. 10.2.
The share of plankton in biogeochemical metabolism of carbon in reef
communities could be estmiated as being between 5 to 20% of the total,
depending upon the depth of the site. The rest, 80-95%, results from the
function of their benthic components, taking into account that 10-30% of
~
60
If 0
Fig. 10.2. Light dependence curves of the gross
photosynthesis (PI' moI02m-2h-1) in bottom reef- 20
flat communities at the Rib reef, GBR; J light
intensity, wt m -2; J bottom area dominated by
coralline calcareous algae; 2 area dominated by
corals. (After Barnes and Devereux 1984)
373
(Marsh 1970; Sorokin 1971b, 1986b; Quasim et al. 1972; Sournia 1976b;
Propp et al. 1983; Griffith et al. 1987). To measure the rates of
photosynthesis, besides the oxygen method the radiocarbon method was
also used in this way, taking into account that it gives them close to the net
production P n (Sorokin 1973c, 1986a; Bittaker and Iverson 1976). To study
reef metabolism microcosms were also constructed, which included basic
elements of bottom biotopes and had a volume of several cubic meters
(Adey 1983; Griffith et al. 1987). The coefficients, necessary for
recalculations of the gross photosynthesis values, measured during different
periods of the day per whole day in periphytic turfs over dead corals, are
given in Table 10.2.
High rates of biogeochemical metabolism in reef biotopes result in
extremely large amplitudes in diurnal fluctuations of O2, CO2 and pH in
waters over the reef. The amplitude of fluctuations of dissolved O2 could
reach 5-8 mg 0 2 1+1. In Fig. 10.1 an example of the diurnal course of rates
of changes in O 2 content (8 02h-1) in water is given, which has been used
for calculations of PI' Pn and MI values per day. In Fig. 10.3 typical
measurement results of O2 content in water over the reef at different times
of the day are shown. The rate of visible increase in O2 content in water,
which is proportional to the net photosynthesis (P n) at midday, ranges
usually from 0.5 to 1.5mg021-1h-l. The rates of decrease at night,
proportional to M I , are expressed by the values 0.2 to 1.5mg021-1h-l at
verage depths of 0.5-1.5 m. The largest fluctuations take place at shallows
over the reef flat and over patch reefs (Fig. 10.4). The corresponding diurnal
fluctuations of alkalinity in such biotopes range usually between 100-300llg
equivalents 1-1, and the shifts of pH - 1 to 2 units - from 7.5 to 8.5-9.5,
caused by processes of photosynthesis, respiration and calcification (Kinsey
1972; Smith 1974). The dependence of reef gross photosynthesis upon
illumination condition is given in Fig. 10.2.
The share of plankton in biogeochemical metabolism of carbon in reef
communities could be estmiated as being between 5 to 20% of the total,
depending upon the depth of the site. The rest, 80-95%, results from the
function of their benthic components, taking into account that 10-30% of
~
60
If 0
Fig. 10.2. Light dependence curves of the gross
photosynthesis (PI' moI02m-2h-1) in bottom reef- 20
flat communities at the Rib reef, GBR; J light
intensity, wt m -2; J bottom area dominated by
coralline calcareous algae; 2 area dominated by
corals. (After Barnes and Devereux 1984)