

the drag force (F d ) on the sphere is balanced by the excess
of the gravitational force (F g ):
F d ¼ Cdr f A p w
2
s
=2
F g ¼ r p À r f
w s g
Introducing R, the submerged specific gravity:
R ¼
r p À r f
r p
Introducing the drag coefficient defined in terms of the
Reynolds number (Re):
Re ¼
w s D
v
Producing an equation for the (Stokes) settling velocity
(w s ):
w s ¼
RgD
2
18v
where Cd is the drag coefficient, r f is the density of the
fluid, r p is the density of the particle, A p is the area of
the particle, w s is the particle velocity, g is the gravitational
acceleration, R is the radius of the spherical object, and v is
kinematic viscosity.
The fall or settling velocity of a particle is assumed to
be a steady-state motion. It is also a function of size, shape,
density, and viscosity of fluid. In addition, it depends on
the extent of the fluid in which it falls, on the number of
particles falling, and on the level of turbulence intensity.
Often the estimation of settling velocity of sediment has
been done by applying predictive formulas developed by
assuming the grains to be spheres. It is well known that
the shape of natural sediment particles departs from
a sphere. This departure will have some consequences,
one being that the settling velocity will be lower than that
of a sphere with the nominal diameter. Due to the practical
implications of this difference, several formulas have been
proposed to calculate the settling velocity of natural
nonspherical grains (e.g., Graf, 1971; Zanke, 1977;
Hallermeier, 1981; Dietrich, 1982; van Rijn, 1984;
Swamee and Ojha, 1991; Julien, 1995; Cheng, 1997;
Soulsby, 1997; Ahrens, 2000). Also, it is the empirical
work of Bagnold (1941) that particularly focuses on aeolian sediment transport.
The deviation of a particle’s shape from a sphere is generally quantified by a shape factor. The most commonly
used is Corey’s shape factor, which is given by
csf ¼
c
ffiffiffiffiffi
ab
p
where a, b, and c are the longest, intermediate, and
shortest axes of the particle.
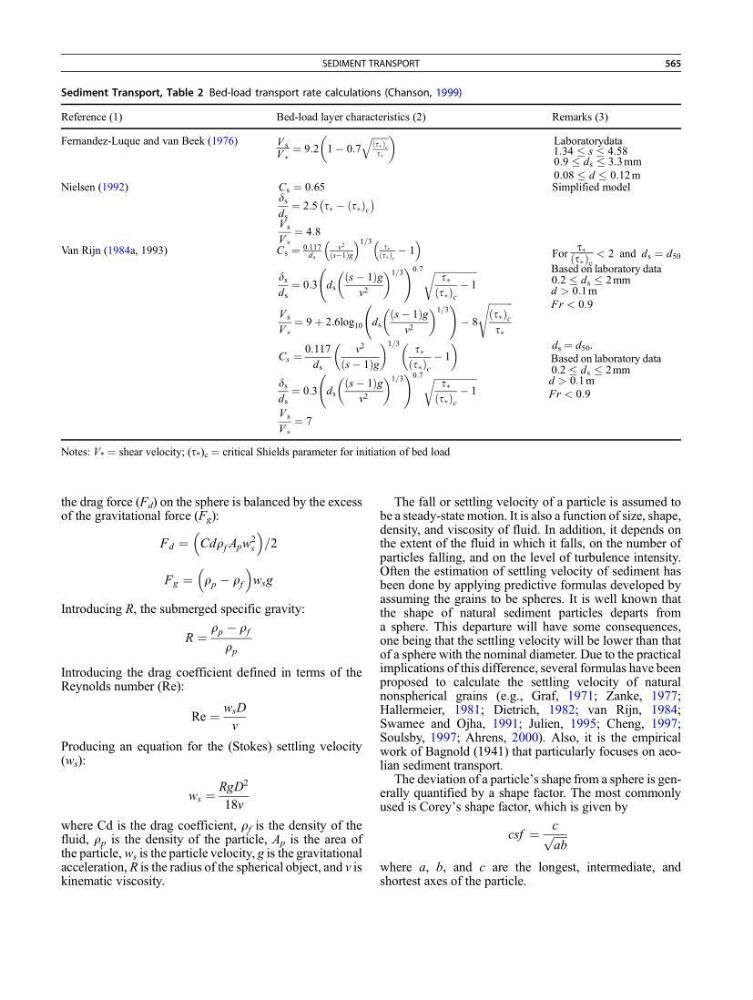
Sediment Transport, Table 2 Bed-load transport rate calculations (Chanson, 1999)
Reference (1)
Bed-load layer characteristics (2)
Remarks (3)
Fernandez-Luque and van Beek (1976)
V s
V Ã
¼ 9:2 1 À 0:7
ffiffiffiffiffiffiffi
tÃ
ð Þ c
tÃ
q
Laboratorydata
1:34 s 4:58
0:9 d s 3:3 mm
0:08 d 0:12 m
Nielsen (1992)
C s ¼ 0:65
d s
d s
¼ 2:5 t à À t Ã
ð Þ c
À
Á
V s
V Ã
¼ 4:8
Simplified model
Van Rijn (1984a, 1993)
C s ¼
0:117
ds
v
2
sÀ1
ð
Þg
1=3 tÃ
tÃ
ð Þ c
À 1
For
t Ã
t Ã
ð Þ c
< 2 and d s ¼ d 50
d s
d s
¼ 0:3 d s
s À 1
ð
Þg
v 2
1=3
! 0:7 ffiffiffiffiffiffiffiffiffiffiffiffiffiffiffiffiffiffi
t Ã
t Ã
ð Þ c
À 1
r
V s
V Ã
¼ 9 þ 2:6log 10 d s
s À 1
ð
Þg
v 2
1=3
!
À 8
ffiffiffiffiffiffiffiffiffiffi
t Ã
ð Þ c
t Ã
s
Based on laboratory data
0:2 d s 2 mm
d > 0:1 m
Fr < 0:9
C s ¼
0:117
d s
v
2
s À 1
ð
Þg
1=3 t Ã
t Ã
ð Þ c
À 1
d s
d s
¼ 0:3 d s
s À 1
ð
Þg
v 2
1=3
! 0:7 ffiffiffiffiffiffiffiffiffiffiffiffiffiffiffiffiffiffi
t Ã
t Ã
ð Þ c
À 1
r
V s
V Ã
¼ 7
d s ¼ d 50 .
Based on laboratory data
0:2 d s 2 mm
d > 0:1 m
Fr < 0:9
Notes: V * ¼ shear velocity; (t * ) c ¼ critical Shields parameter for initiation of bed load
SEDIMENT TRANSPORT
565