

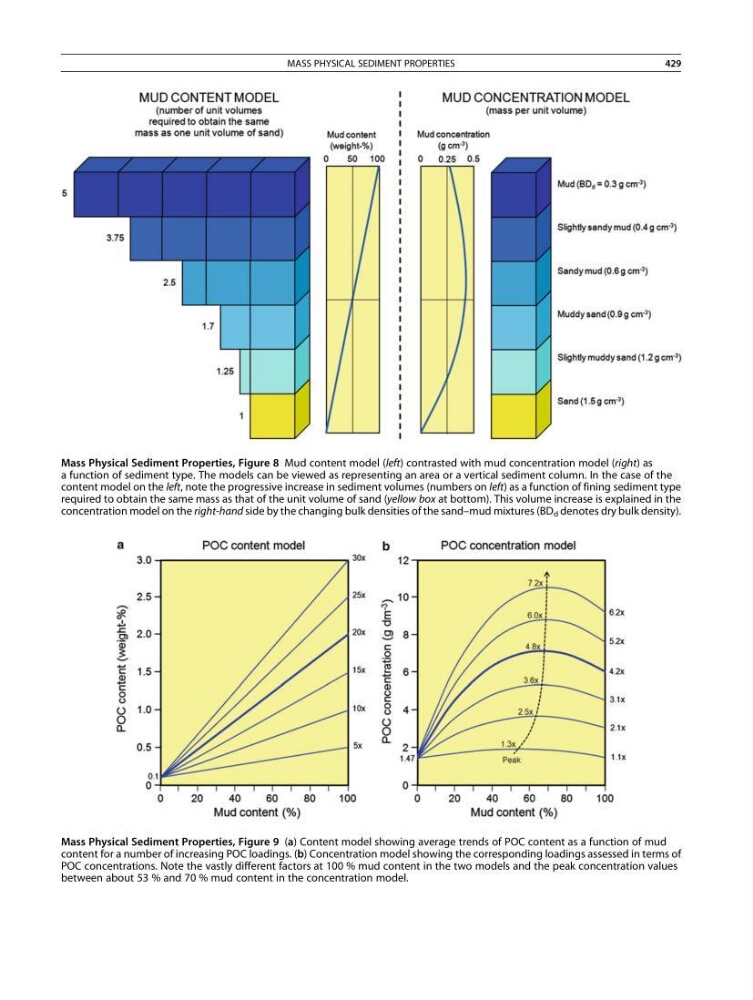
Mass Physical Sediment Properties, Figure 8 Mud content model (left) contrasted with mud concentration model (right) as
a function of sediment type. The models can be viewed as representing an area or a vertical sediment column. In the case of the
content model on the left, note the progressive increase in sediment volumes (numbers on left) as a function of fining sediment type
required to obtain the same mass as that of the unit volume of sand (yellow box at bottom). This volume increase is explained in the
concentration model on the right-hand side by the changing bulk densities of the sand–mud mixtures (BD d denotes dry bulk density).
Mass Physical Sediment Properties, Figure 9 (a) Content model showing average trends of POC content as a function of mud
content for a number of increasing POC loadings. (b) Concentration model showing the corresponding loadings assessed in terms of
POC concentrations. Note the vastly different factors at 100 % mud content in the two models and the peak concentration values
between about 53 % and 70 % mud content in the concentration model.
MASS PHYSICAL SEDIMENT PROPERTIES
429
a function of sediment type. The models can be viewed as representing an area or a vertical sediment column. In the case of the
content model on the left, note the progressive increase in sediment volumes (numbers on left) as a function of fining sediment type
required to obtain the same mass as that of the unit volume of sand (yellow box at bottom). This volume increase is explained in the
concentration model on the right-hand side by the changing bulk densities of the sand–mud mixtures (BD d denotes dry bulk density).
Mass Physical Sediment Properties, Figure 9 (a) Content model showing average trends of POC content as a function of mud
content for a number of increasing POC loadings. (b) Concentration model showing the corresponding loadings assessed in terms of
POC concentrations. Note the vastly different factors at 100 % mud content in the two models and the peak concentration values
between about 53 % and 70 % mud content in the concentration model.
MASS PHYSICAL SEDIMENT PROPERTIES
429