

numbers in 1 m
2 at all sites with the amount of organic
matter or POC in increasingly larger areas (or volumes),
as illustrated in the mud content model on the left side of
Figure 8. In effect, the amount of potentially available
food would be greatly overestimated, especially at high
mud contents.
This pitfall becomes even clearer when comparing the
POC content model of Figure 9a with the corresponding
POC concentration model in Figure 9b, where the average
trends in content and concentration of a variety of sediment
POC loadings are shown. A globally common trend in POC
contents is represented by the thick blue line in Figure 9a,
with about 0.1 % POC in sand and 2 % in mud.
Applying the Wadden Sea mud concentration model,
the corresponding trend reaches a peak at a mud content
of about 68 % (Figure 9b), a factor of 4.8 larger than for
pure sand. At 100 % mud content, by contrast, the POC
concentration has decreased to a factor of only 4.2 relative
to pure sand. Clearly, the factors in the POC concentration
model stand in stark contrast to those in the POC content
model, the highest amount of potential food being available in mixed sediment, not in pure mud as suggested
by the POC content model. This has far-reaching
implications for the assessment of, among others,
animal–sediment relationships in terms of species
distribution models, standing stocks and turnover of
available food or higher-quality components thereof, and
ecotoxicological impacts.
Ecotoxicological effects are a case in point. Studying
the effect of sediment contamination by toxic substances
on benthic animals in dead-end canals of coastal lagoons
along the Delaware and Maryland coasts of the USA,
Maxted et al. (1997) documented a marked overall
decrease in species richness and biomass with increasing
mud content. Assuming highest contamination to be coincident with highest mud contents, the applied linear
regression model yielded statistically significant correlation coefficients of r ¼ –0.75 and r ¼ –0.73, respectively.
In so doing, these authors evidently did not recognize the
counterintuitive signs of ecological recovery visible at
mud contents exceeding about 80 %. Indeed, when
applying a curvilinear regression model (Figure 10a, b),
the present authors achieved considerably better
correlations (r ¼ –0.83 and r ¼ –0.81, respectively),
demonstrating that a concentration model of the type
illustrated in Figure 9b, which accounts for the partial
reversal of the toxic effect at high mud contents, would
have been more meaningful.
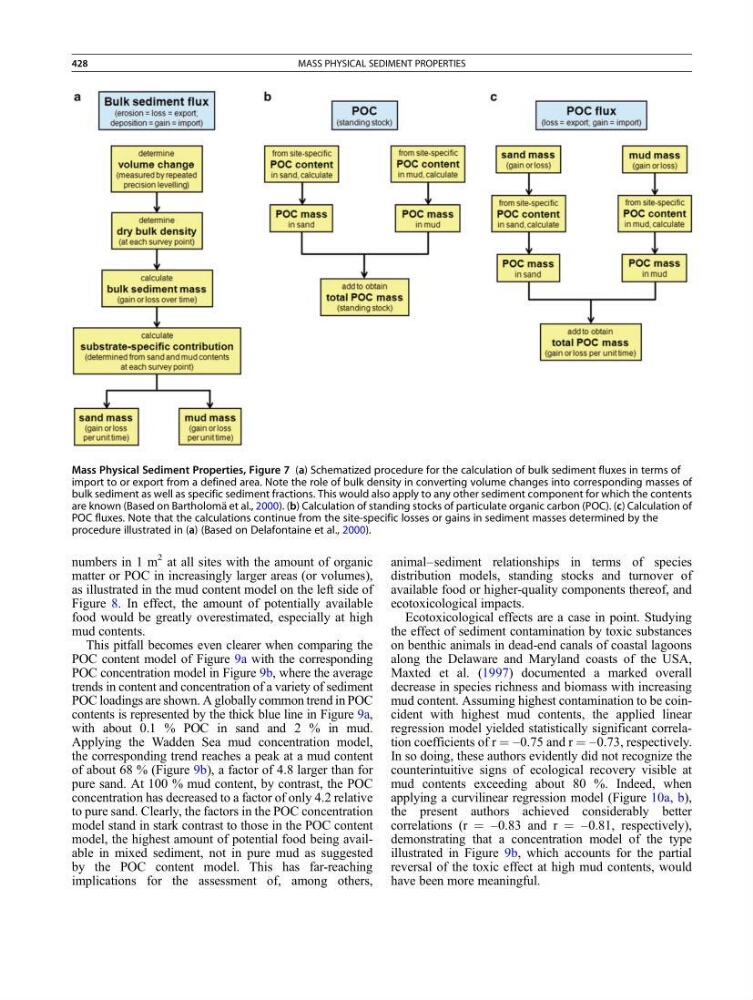
Mass Physical Sediment Properties, Figure 7 (a) Schematized procedure for the calculation of bulk sediment fluxes in terms of
import to or export from a defined area. Note the role of bulk density in converting volume changes into corresponding masses of
bulk sediment as well as specific sediment fractions. This would also apply to any other sediment component for which the contents
are known (Based on Bartholoma ¨ et al., 2000). (b) Calculation of standing stocks of particulate organic carbon (POC). (c) Calculation of
POC fluxes. Note that the calculations continue from the site-specific losses or gains in sediment masses determined by the
procedure illustrated in (a) (Based on Delafontaine et al., 2000).
428
MASS PHYSICAL SEDIMENT PROPERTIES
2 at all sites with the amount of organic
matter or POC in increasingly larger areas (or volumes),
as illustrated in the mud content model on the left side of
Figure 8. In effect, the amount of potentially available
food would be greatly overestimated, especially at high
mud contents.
This pitfall becomes even clearer when comparing the
POC content model of Figure 9a with the corresponding
POC concentration model in Figure 9b, where the average
trends in content and concentration of a variety of sediment
POC loadings are shown. A globally common trend in POC
contents is represented by the thick blue line in Figure 9a,
with about 0.1 % POC in sand and 2 % in mud.
Applying the Wadden Sea mud concentration model,
the corresponding trend reaches a peak at a mud content
of about 68 % (Figure 9b), a factor of 4.8 larger than for
pure sand. At 100 % mud content, by contrast, the POC
concentration has decreased to a factor of only 4.2 relative
to pure sand. Clearly, the factors in the POC concentration
model stand in stark contrast to those in the POC content
model, the highest amount of potential food being available in mixed sediment, not in pure mud as suggested
by the POC content model. This has far-reaching
implications for the assessment of, among others,
animal–sediment relationships in terms of species
distribution models, standing stocks and turnover of
available food or higher-quality components thereof, and
ecotoxicological impacts.
Ecotoxicological effects are a case in point. Studying
the effect of sediment contamination by toxic substances
on benthic animals in dead-end canals of coastal lagoons
along the Delaware and Maryland coasts of the USA,
Maxted et al. (1997) documented a marked overall
decrease in species richness and biomass with increasing
mud content. Assuming highest contamination to be coincident with highest mud contents, the applied linear
regression model yielded statistically significant correlation coefficients of r ¼ –0.75 and r ¼ –0.73, respectively.
In so doing, these authors evidently did not recognize the
counterintuitive signs of ecological recovery visible at
mud contents exceeding about 80 %. Indeed, when
applying a curvilinear regression model (Figure 10a, b),
the present authors achieved considerably better
correlations (r ¼ –0.83 and r ¼ –0.81, respectively),
demonstrating that a concentration model of the type
illustrated in Figure 9b, which accounts for the partial
reversal of the toxic effect at high mud contents, would
have been more meaningful.
Mass Physical Sediment Properties, Figure 7 (a) Schematized procedure for the calculation of bulk sediment fluxes in terms of
import to or export from a defined area. Note the role of bulk density in converting volume changes into corresponding masses of
bulk sediment as well as specific sediment fractions. This would also apply to any other sediment component for which the contents
are known (Based on Bartholoma ¨ et al., 2000). (b) Calculation of standing stocks of particulate organic carbon (POC). (c) Calculation of
POC fluxes. Note that the calculations continue from the site-specific losses or gains in sediment masses determined by the
procedure illustrated in (a) (Based on Delafontaine et al., 2000).
428
MASS PHYSICAL SEDIMENT PROPERTIES