

Bird and Duarte (1989) warned about generating
spurious trends devoid of scientific meaning when studying relationships between bacteria measured as numbers
or masses per unit area or volume (concentrations) and
organic matter measured as masses per unit mass
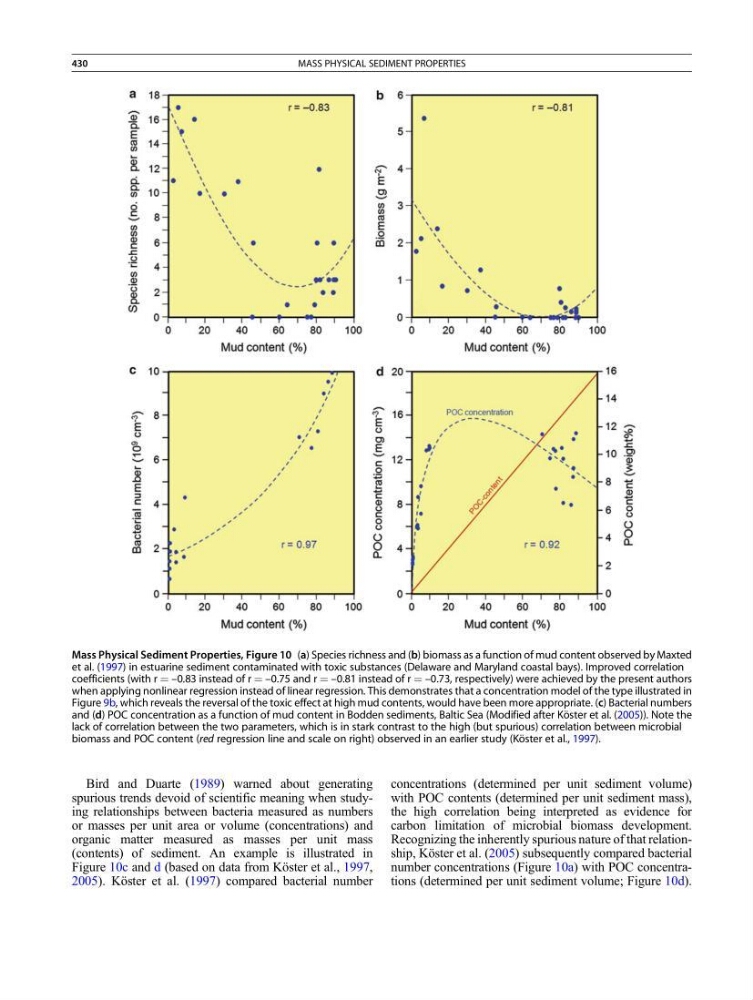
(contents) of sediment. An example is illustrated in
Figure 10c and d (based on data from Köster et al., 1997,
2005). Köster et al. (1997) compared bacterial number
concentrations (determined per unit sediment volume)
with POC contents (determined per unit sediment mass),
the high correlation being interpreted as evidence for
carbon limitation of microbial biomass development.
Recognizing the inherently spurious nature of that relationship, Köster et al. (2005) subsequently compared bacterial
number concentrations (Figure 10a) with POC concentrations (determined per unit sediment volume; Figure 10d).
Mass Physical Sediment Properties, Figure 10 (a) Species richness and (b) biomass as a function of mud content observed by Maxted
et al. (1997) in estuarine sediment contaminated with toxic substances (Delaware and Maryland coastal bays). Improved correlation
coefficients (with r ¼ –0.83 instead of r ¼ –0.75 and r ¼ –0.81 instead of r ¼ –0.73, respectively) were achieved by the present authors
when applying nonlinear regression instead of linear regression. This demonstrates that a concentration model of the type illustrated in
Figure 9b, which reveals the reversal of the toxic effect at high mud contents, would have been more appropriate. (c) Bacterial numbers
and (d) POC concentration as a function of mud content in Bodden sediments, Baltic Sea (Modified after Ko ¨ ster et al. (2005)). Note the
lack of correlation between the two parameters, which is in stark contrast to the high (but spurious) correlation between microbial
biomass and POC content (red regression line and scale on right) observed in an earlier study (Ko ¨ ster et al., 1997).
430
MASS PHYSICAL SEDIMENT PROPERTIES
spurious trends devoid of scientific meaning when studying relationships between bacteria measured as numbers
or masses per unit area or volume (concentrations) and
organic matter measured as masses per unit mass
(contents) of sediment. An example is illustrated in
Figure 10c and d (based on data from Köster et al., 1997,
2005). Köster et al. (1997) compared bacterial number
concentrations (determined per unit sediment volume)
with POC contents (determined per unit sediment mass),
the high correlation being interpreted as evidence for
carbon limitation of microbial biomass development.
Recognizing the inherently spurious nature of that relationship, Köster et al. (2005) subsequently compared bacterial
number concentrations (Figure 10a) with POC concentrations (determined per unit sediment volume; Figure 10d).
Mass Physical Sediment Properties, Figure 10 (a) Species richness and (b) biomass as a function of mud content observed by Maxted
et al. (1997) in estuarine sediment contaminated with toxic substances (Delaware and Maryland coastal bays). Improved correlation
coefficients (with r ¼ –0.83 instead of r ¼ –0.75 and r ¼ –0.81 instead of r ¼ –0.73, respectively) were achieved by the present authors
when applying nonlinear regression instead of linear regression. This demonstrates that a concentration model of the type illustrated in
Figure 9b, which reveals the reversal of the toxic effect at high mud contents, would have been more appropriate. (c) Bacterial numbers
and (d) POC concentration as a function of mud content in Bodden sediments, Baltic Sea (Modified after Ko ¨ ster et al. (2005)). Note the
lack of correlation between the two parameters, which is in stark contrast to the high (but spurious) correlation between microbial
biomass and POC content (red regression line and scale on right) observed in an earlier study (Ko ¨ ster et al., 1997).
430
MASS PHYSICAL SEDIMENT PROPERTIES