

Finally, models provide a means for conducting
“whole-system experiments” which are nearly impossible
to do outside the virtual realm in coastal systems. Some of
our most fundamental understanding of aquatic systems
has come from relatively rare, real-world, whole-system
experiments which capture the response of entire ecosystems. Arguably the prime examples of these are the lake
fertilization experiments of Schindler (1974) in the Experimental Lakes Area of Canada, which cemented our
understanding of phosphorus as the primary limiting nutrient in temperate lakes and the cause of lake eutrophication
in the 1960s and 1970s. While some early examples of
whole-system experiments exist for estuaries, their open
connection to the sea and increasing governmental protections make these sorts of whole-system experiments
nearly impossible outside of mesocosms (Nixon et al.,
1986). Models provide a way of conducting virtual
whole-system experiments not possible in the real world.
One can ask how an estuary will respond to changes in
nutrient loading, climate, fishing pressure, food web structure, or restoration. This “what if?” capability gives
models a predictive, forecasting capability which forms
the basis of their use in informing estuarine management.
Below we summarize the major uses of models in estuarine science:
1. Heuristic (research) tool – understanding system structure and function, hypothesis testing, estimating values
in the absence of observations, and quantitative explanation of ecological theories and empirical models
2. Synthesis of extensive datasets – scaling data over time
and space (i.e., interpolation and extrapolation), creating system-level budgets, identifying gaps in knowledge, and guiding sampling methods and monitoring
programs
3. Simulation analysis – ability to conduct whole-system
“what-if?” experiments and prediction/forecasting of
future ecosystem states
4. Management – simulation of estuarine response to
nutrient management, setting total maximum daily
loads (TMDLs) of pollutants, and development of restoration plans
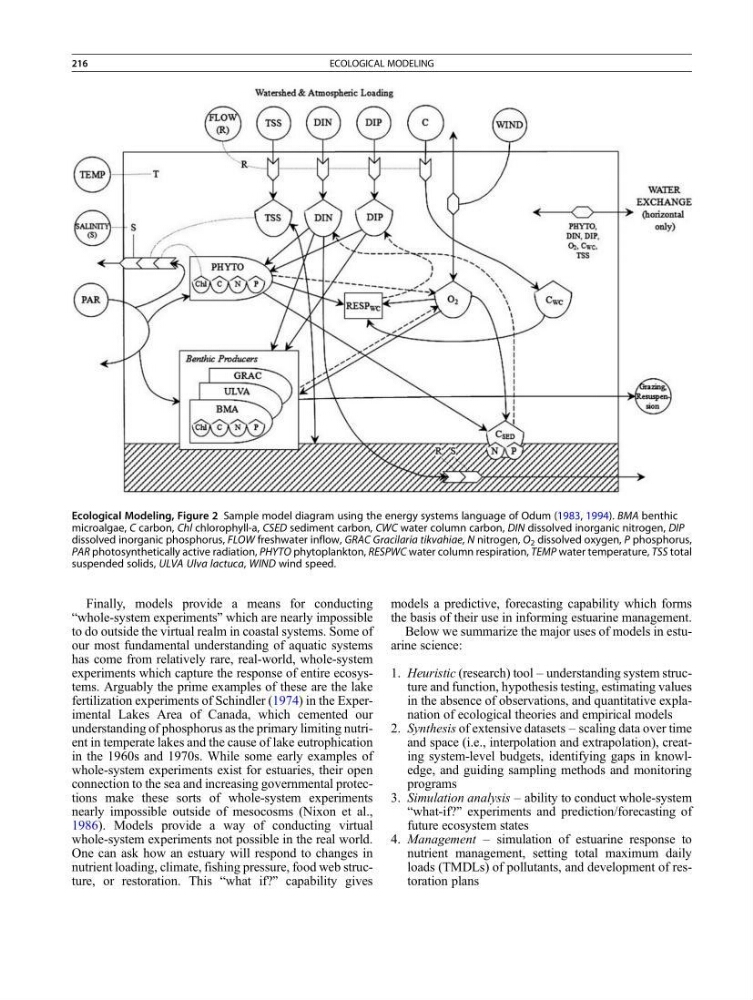
Ecological Modeling, Figure 2 Sample model diagram using the energy systems language of Odum (1983, 1994). BMA benthic
microalgae, C carbon, Chl chlorophyll-a, CSED sediment carbon, CWC water column carbon, DIN dissolved inorganic nitrogen, DIP
dissolved inorganic phosphorus, FLOW freshwater inflow, GRAC Gracilaria tikvahiae, N nitrogen, O 2 dissolved oxygen, P phosphorus,
PAR photosynthetically active radiation, PHYTO phytoplankton, RESPWC water column respiration, TEMP water temperature, TSS total
suspended solids, ULVA Ulva lactuca, WIND wind speed.
216
ECOLOGICAL MODELING
“whole-system experiments” which are nearly impossible
to do outside the virtual realm in coastal systems. Some of
our most fundamental understanding of aquatic systems
has come from relatively rare, real-world, whole-system
experiments which capture the response of entire ecosystems. Arguably the prime examples of these are the lake
fertilization experiments of Schindler (1974) in the Experimental Lakes Area of Canada, which cemented our
understanding of phosphorus as the primary limiting nutrient in temperate lakes and the cause of lake eutrophication
in the 1960s and 1970s. While some early examples of
whole-system experiments exist for estuaries, their open
connection to the sea and increasing governmental protections make these sorts of whole-system experiments
nearly impossible outside of mesocosms (Nixon et al.,
1986). Models provide a way of conducting virtual
whole-system experiments not possible in the real world.
One can ask how an estuary will respond to changes in
nutrient loading, climate, fishing pressure, food web structure, or restoration. This “what if?” capability gives
models a predictive, forecasting capability which forms
the basis of their use in informing estuarine management.
Below we summarize the major uses of models in estuarine science:
1. Heuristic (research) tool – understanding system structure and function, hypothesis testing, estimating values
in the absence of observations, and quantitative explanation of ecological theories and empirical models
2. Synthesis of extensive datasets – scaling data over time
and space (i.e., interpolation and extrapolation), creating system-level budgets, identifying gaps in knowledge, and guiding sampling methods and monitoring
programs
3. Simulation analysis – ability to conduct whole-system
“what-if?” experiments and prediction/forecasting of
future ecosystem states
4. Management – simulation of estuarine response to
nutrient management, setting total maximum daily
loads (TMDLs) of pollutants, and development of restoration plans
Ecological Modeling, Figure 2 Sample model diagram using the energy systems language of Odum (1983, 1994). BMA benthic
microalgae, C carbon, Chl chlorophyll-a, CSED sediment carbon, CWC water column carbon, DIN dissolved inorganic nitrogen, DIP
dissolved inorganic phosphorus, FLOW freshwater inflow, GRAC Gracilaria tikvahiae, N nitrogen, O 2 dissolved oxygen, P phosphorus,
PAR photosynthetically active radiation, PHYTO phytoplankton, RESPWC water column respiration, TEMP water temperature, TSS total
suspended solids, ULVA Ulva lactuca, WIND wind speed.
216
ECOLOGICAL MODELING