

'f, org.C
2.0
1.5
10
0.5
o
o
o
o
•
o
•
•
•
• •
o. •
o
o.
••
•
o 0 •
0.01
0.1
1
mg f kg Hg
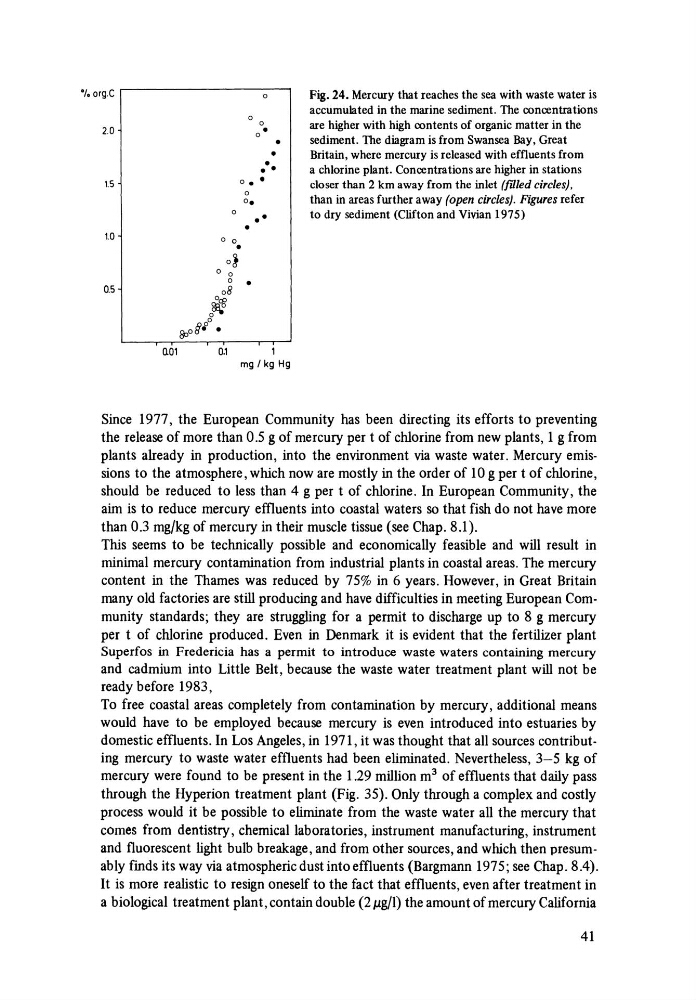
Fig. 24. Mercury that reaches the sea with waste water is
accumulated in the marine sediment. The concentrations
are higher with high contents of organic matter in the
sediment. The diagram is from Swansea Bay, Great
Britain, where mercury is released with effluents from
a chlorine plant. Concentrations are higher in stations
closer than 2 km away from the inlet (filled circles),
than in areas further away (open circles). Figures refer
to dry sediment (Clifton and Vivian 1975)
Since 1977, the European Community has been directing its efforts to preventing
the release of more than 0.5 g of mercury per t of chlorine from new plants, 1 g from
plants already in production, into the environment via waste water. Mercury emissions to the atmosphere, which now are mostly in the order of 10 g per t of chlorine,
should be reduced to less than 4 g per t of chlorine. In European Community, the
aim is to reduce mercury effluents into coastal waters so that fish do not have more
than 0.3 mg/kg of mercury in their muscle tissue (see Chap. 8.1).
This seems to be technically possible and economically feasible and will result in
minimal mercury contamination from industrial plants in coastal areas. The mercury
content in the Thames was reduced by 75% in 6 years. However, in Great Britain
many old factories are still producing and have difficulties in meeting European Community standards; they are struggling for a permit to discharge up to 8 g mercury
per t of chlorine produced. Even in Denmark it is evident that the fertilizer plant
Superfos in Fredericia has a permit to introduce waste waters containing mercury
and cadmium into Little Belt, because the waste water treatment plant will not be
ready before 1983,
To free coastal areas completely from contamination by mercury, additional means
would have to be employed because mercury is even introduced into estuaries by
domestic effluents. In Los Angeles, in 1971, it was thought that all sources contributing mercury to waste water effluents had been eliminated. Nevertheless, 3-5 kg of
mercury were found to be present in the 1.29 million m 3 of effluents that daily pass
through the Hyperion treatment plant (Fig. 35). Only through a complex and costly
process would it be possible to eliminate from the waste water all the mercury that
cOmes from dentistry, chemical laboratories, instrument manufacturing, instrument
and fluorescent light bulb breakage, and from other sources, and which then presumably finds its way via atmospheric dust into effluents (Bargmann 1975; see Chap. 8.4).
It is more realistic to resign oneself to the fact that effluents, even after treatment in
a biological treatment plant, contain double (2 J1.g/I) the amount of mercury California
41
2.0
1.5
10
0.5
o
o
o
o
•
o
•
•
•
• •
o. •
o
o.
••
•
o 0 •
0.01
0.1
1
mg f kg Hg
Fig. 24. Mercury that reaches the sea with waste water is
accumulated in the marine sediment. The concentrations
are higher with high contents of organic matter in the
sediment. The diagram is from Swansea Bay, Great
Britain, where mercury is released with effluents from
a chlorine plant. Concentrations are higher in stations
closer than 2 km away from the inlet (filled circles),
than in areas further away (open circles). Figures refer
to dry sediment (Clifton and Vivian 1975)
Since 1977, the European Community has been directing its efforts to preventing
the release of more than 0.5 g of mercury per t of chlorine from new plants, 1 g from
plants already in production, into the environment via waste water. Mercury emissions to the atmosphere, which now are mostly in the order of 10 g per t of chlorine,
should be reduced to less than 4 g per t of chlorine. In European Community, the
aim is to reduce mercury effluents into coastal waters so that fish do not have more
than 0.3 mg/kg of mercury in their muscle tissue (see Chap. 8.1).
This seems to be technically possible and economically feasible and will result in
minimal mercury contamination from industrial plants in coastal areas. The mercury
content in the Thames was reduced by 75% in 6 years. However, in Great Britain
many old factories are still producing and have difficulties in meeting European Community standards; they are struggling for a permit to discharge up to 8 g mercury
per t of chlorine produced. Even in Denmark it is evident that the fertilizer plant
Superfos in Fredericia has a permit to introduce waste waters containing mercury
and cadmium into Little Belt, because the waste water treatment plant will not be
ready before 1983,
To free coastal areas completely from contamination by mercury, additional means
would have to be employed because mercury is even introduced into estuaries by
domestic effluents. In Los Angeles, in 1971, it was thought that all sources contributing mercury to waste water effluents had been eliminated. Nevertheless, 3-5 kg of
mercury were found to be present in the 1.29 million m 3 of effluents that daily pass
through the Hyperion treatment plant (Fig. 35). Only through a complex and costly
process would it be possible to eliminate from the waste water all the mercury that
cOmes from dentistry, chemical laboratories, instrument manufacturing, instrument
and fluorescent light bulb breakage, and from other sources, and which then presumably finds its way via atmospheric dust into effluents (Bargmann 1975; see Chap. 8.4).
It is more realistic to resign oneself to the fact that effluents, even after treatment in
a biological treatment plant, contain double (2 J1.g/I) the amount of mercury California
41