

]
Ii;
11.
1910-11
i96O-69
1950·59
1940·49
1930·39
1920·29
1910·19
1900·09
1890·99
1880·89
1810-19
1860-69
1850·59
1840-49
1830·39
1820·29
~-----------1,400BC
±0.004 (n = 4)
- - - - - - - - - - - -
1.500BC
±0.006 (n - 2)
~-----------I
I
!
I
,
I
o
0.04
0.08
0.12
I
0.16
Mean Mercury Concentration (mg/dry kg)
= 5)
±0.015
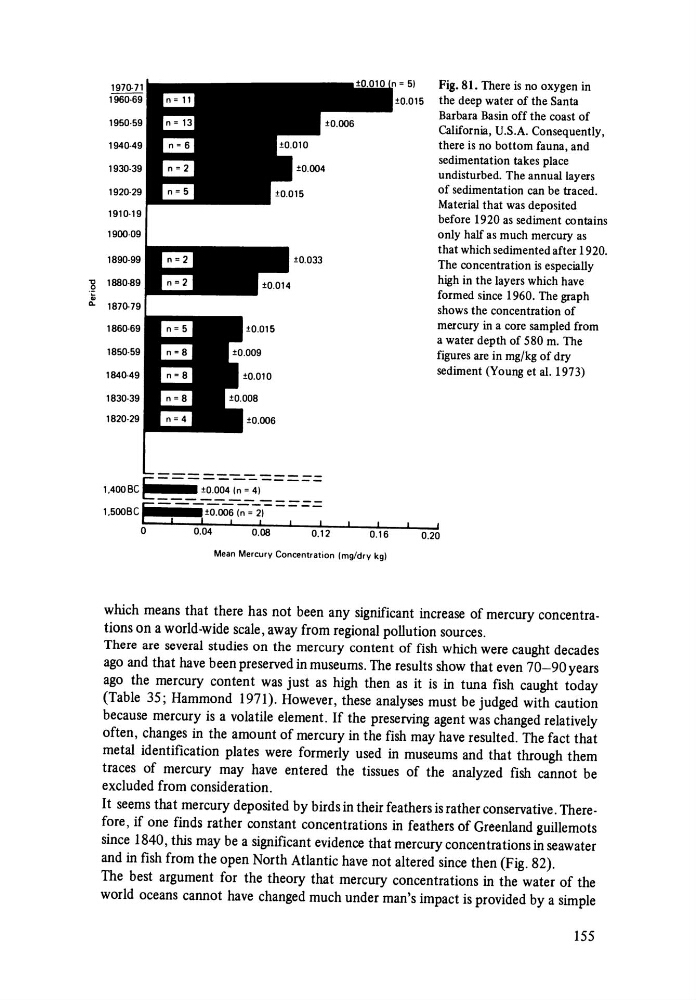
Fig. 81. There is no oxygen in
the deep water of the Santa
Barbara Basin off the coast of
California, U.S.A. Consequently,
there is no bottom fauna, and
sedimentation takes place
undisturbed. The annual layers
of sedimentation can be traced.
Material that was deposited
before 1920 as sediment contains
only half as much mercury as
that which sedimented after 1920.
The concentration is especially
high in the layers which have
formed since 1960. The graph
shows the concentration of
mercury in a core sampled from
a water depth of 580 m. The
figures are in mg/kg of dry
sediment (Young et al. 1973)
,
0.20
which means that there has not been any significant increase of mercury concentra·
tions on a world·wide scale, away from regional pollution sources.
There are several studies on the mercury content of fish which were caught decades
ago and that have been preserved in museums. The results show that even 70-90 years
ago the mercury content was just as high then as it is in tuna fish caught today
(Table 35; Hammond 1971). However, these analyses must be judged with caution
because mercury is a volatile element. If the preserving agent was changed relatively
often, changes in the amount of mercury in the fish may have resulted. The fact that
metal identification plates were formerly used in museums and that through them
traces of mercury may have entered the tissues of the analyzed fish cannot be
excluded from consideration.
It seems that mercury deposited by birds in their feathers is rather conservative. There·
fore, if one finds rather constant concentrations in feathers of Greenland guillemots
since 1840, this may be a significant evidence that mercury concentrations in seawater
and in fish from the open North Atlantic have not altered since then (Fig. 82).
The best argument for the theory that mercury concentrations in the water of the
world oceans cannot have changed much under man's impact is provided by a simple
155
Ii;
11.
1910-11
i96O-69
1950·59
1940·49
1930·39
1920·29
1910·19
1900·09
1890·99
1880·89
1810-19
1860-69
1850·59
1840-49
1830·39
1820·29
~-----------1,400BC
±0.004 (n = 4)
- - - - - - - - - - - -
1.500BC
±0.006 (n - 2)
~-----------I
I
!
I
,
I
o
0.04
0.08
0.12
I
0.16
Mean Mercury Concentration (mg/dry kg)
= 5)
±0.015
Fig. 81. There is no oxygen in
the deep water of the Santa
Barbara Basin off the coast of
California, U.S.A. Consequently,
there is no bottom fauna, and
sedimentation takes place
undisturbed. The annual layers
of sedimentation can be traced.
Material that was deposited
before 1920 as sediment contains
only half as much mercury as
that which sedimented after 1920.
The concentration is especially
high in the layers which have
formed since 1960. The graph
shows the concentration of
mercury in a core sampled from
a water depth of 580 m. The
figures are in mg/kg of dry
sediment (Young et al. 1973)
,
0.20
which means that there has not been any significant increase of mercury concentra·
tions on a world·wide scale, away from regional pollution sources.
There are several studies on the mercury content of fish which were caught decades
ago and that have been preserved in museums. The results show that even 70-90 years
ago the mercury content was just as high then as it is in tuna fish caught today
(Table 35; Hammond 1971). However, these analyses must be judged with caution
because mercury is a volatile element. If the preserving agent was changed relatively
often, changes in the amount of mercury in the fish may have resulted. The fact that
metal identification plates were formerly used in museums and that through them
traces of mercury may have entered the tissues of the analyzed fish cannot be
excluded from consideration.
It seems that mercury deposited by birds in their feathers is rather conservative. There·
fore, if one finds rather constant concentrations in feathers of Greenland guillemots
since 1840, this may be a significant evidence that mercury concentrations in seawater
and in fish from the open North Atlantic have not altered since then (Fig. 82).
The best argument for the theory that mercury concentrations in the water of the
world oceans cannot have changed much under man's impact is provided by a simple
155