

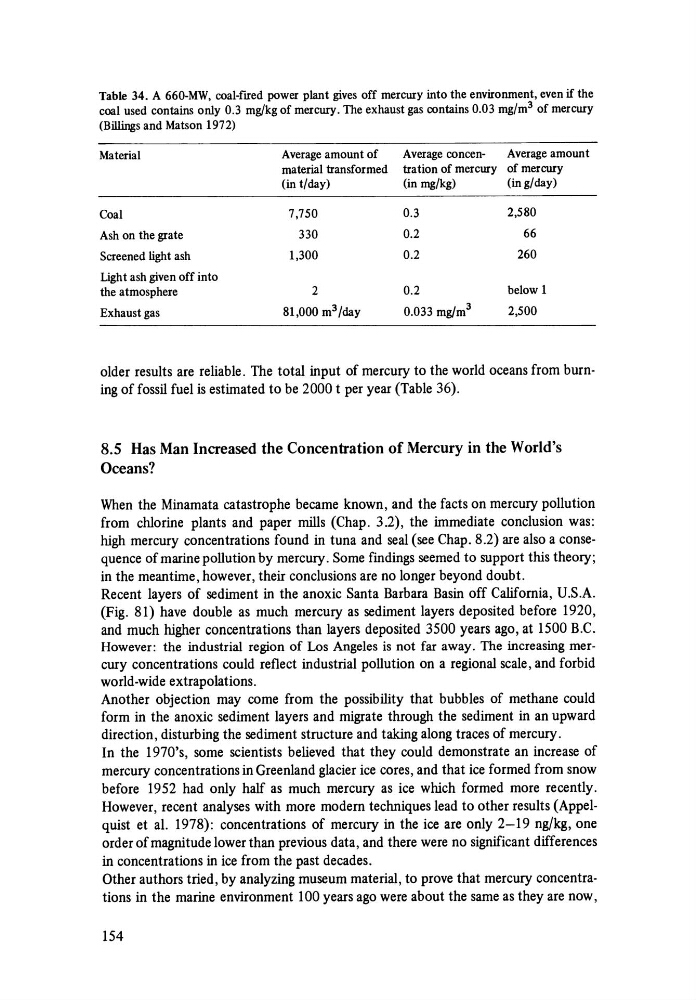
Table 34. A 660-MW, coal-fIred power plant gives off mercury into the environment, even if the
coal used contains only 0.3 mg/kg of mercury. The exhaust gas contains 0.03 mg/m 3 of mercury
(Billings and Matson 1972)
Material
Coal
Ash on the grate
Screened light ash
Light ash given off into
the atmosphere
Exhaust gas
Average amount of
material transformed
(in t/day)
7,750
330
1,300
2
81,000 m 3 /day
Average concenAverage amount
tration of mercury of mercury
(in mg/kg)
(ing/day)
0.3
2,580
0.2
66
0.2
260
0.2
below 1
0.033 mg/m 3
2,500
older results are reliable. The total input of mercury to the world oceans from burning of fossil fuel is estimated to be 2000 t per year (Table 36).
8.5 Has Man Increased the Concentration of Mercury in the World's
Oceans?
When the Minamata catastrophe became known, and the facts on mercury pollution
from chlorine plants and paper mills (Chap. 3.2), the immediate conclusion was:
high mercury concentrations found in tuna and seal (see Chap. 8.2) are also a consequence of marine pollution by mercury. Some findings seemed to support this theory;
in the meantime, however, their conclusions are no longer beyond doubt.
Recent layers of sediment in the anoxic Santa Barbara Basin off California, U.S.A.
(Fig. 81) have double as much mercury as sediment layers deposited before 1920,
and much higher concentrations than layers deposited 3500 years ago, at 1500 B.C.
However: the industrial region of Los Angeles is not far away. The increasing mercury concentrations could reflect industrial pollution on a regional scale, and forbid
world-wide extrapolations.
Another objection may come from the possibility that bubbles of methane could
form in the anoxic sediment layers and migrate through the sediment in an upward
direction, disturbing the sediment structure and taking along traces of mercury.
In the 1970's, some scientists believed that they could demonstrate an increase of
mercury concentrations in Greenland glacier ice cores, and that ice formed from snow
before 1952 had only half as much mercury as ice which formed more recently.
However, recent analyses with more modern techniques lead to other results (Appelquist et al. 1978): concentrations of mercury in the ice are only 2-19 ng/kg, one
order of magnitude lower than previous data, and there were no significant differences
in concentrations in ice from the past decades.
Other authors tried, by analyzing museum material, to prove that mercury concentrations in the marine environment 100 years ago were about the same as they are now,
154
coal used contains only 0.3 mg/kg of mercury. The exhaust gas contains 0.03 mg/m 3 of mercury
(Billings and Matson 1972)
Material
Coal
Ash on the grate
Screened light ash
Light ash given off into
the atmosphere
Exhaust gas
Average amount of
material transformed
(in t/day)
7,750
330
1,300
2
81,000 m 3 /day
Average concenAverage amount
tration of mercury of mercury
(in mg/kg)
(ing/day)
0.3
2,580
0.2
66
0.2
260
0.2
below 1
0.033 mg/m 3
2,500
older results are reliable. The total input of mercury to the world oceans from burning of fossil fuel is estimated to be 2000 t per year (Table 36).
8.5 Has Man Increased the Concentration of Mercury in the World's
Oceans?
When the Minamata catastrophe became known, and the facts on mercury pollution
from chlorine plants and paper mills (Chap. 3.2), the immediate conclusion was:
high mercury concentrations found in tuna and seal (see Chap. 8.2) are also a consequence of marine pollution by mercury. Some findings seemed to support this theory;
in the meantime, however, their conclusions are no longer beyond doubt.
Recent layers of sediment in the anoxic Santa Barbara Basin off California, U.S.A.
(Fig. 81) have double as much mercury as sediment layers deposited before 1920,
and much higher concentrations than layers deposited 3500 years ago, at 1500 B.C.
However: the industrial region of Los Angeles is not far away. The increasing mercury concentrations could reflect industrial pollution on a regional scale, and forbid
world-wide extrapolations.
Another objection may come from the possibility that bubbles of methane could
form in the anoxic sediment layers and migrate through the sediment in an upward
direction, disturbing the sediment structure and taking along traces of mercury.
In the 1970's, some scientists believed that they could demonstrate an increase of
mercury concentrations in Greenland glacier ice cores, and that ice formed from snow
before 1952 had only half as much mercury as ice which formed more recently.
However, recent analyses with more modern techniques lead to other results (Appelquist et al. 1978): concentrations of mercury in the ice are only 2-19 ng/kg, one
order of magnitude lower than previous data, and there were no significant differences
in concentrations in ice from the past decades.
Other authors tried, by analyzing museum material, to prove that mercury concentrations in the marine environment 100 years ago were about the same as they are now,
154