

162
130,,1) = 2.26 - 1.5 . ODS(l)
Eq. 6
B. Chlorophyll ~ fluorescence excitation algorithm
The uncorrected fluorescence excitation spectrum of phytoplankton
will be proportional to the absorption bands which are effective in
transferring energy to the fluorescing molecules, the efficiency of
transfer of the absorbed energy, the fluorescence efficiency of the fluorescing molecules, and the intensity of the excitation beam. The significance of the system excitation energy on the spectrum can be appreciated
by examining figure 4 which shows an uncorrected sample spectrum, the
system spectrum determined with rhodamine-b, and the sample spectrum corrected for spectral properties of the system alone.
The corrected spectrum is dramatically different from the uncorrected spectrum, and it is
especially important to note that the chlorophyll ~ bands at 380 nrn. and
435 nm. become more prominent in the corrected spectrum.
For an optically thin sample, the correction depicted in figure 4
is sufficient.
In general the uncorrected spectrum is described by equation 7:
Flu (A) ex !Pfl (A) . A (A)
Eq. 7
where Flu(A) is the uncorrected fluorescence signal, !Pfl(A) is the fluorescence efficiency for absorbed light, and A(A) is the absorbed light.
The proportionality in this equation and equation 12 below is appropriate
because only a fraction of the fluoresced light is detected.
For an op-'
tically thin sample where the emergent beam is approx~mately equal to the
incident beam A(A) can be described by equation 8:
A(A) = E(A) 'ODS(A)
Eq. 8
where ODS (A) is the sample optical density and E(Aj is the incident light
intensity.
However, because the samples are not optically thin, we have
replaced the incident intensity with the mean light intensity: E.
This
value is a function of the incident intensity, the ODS for the sample,
relative to a blank, plus the OD B for a blank filter relative to air.
Integrating Beers Law:
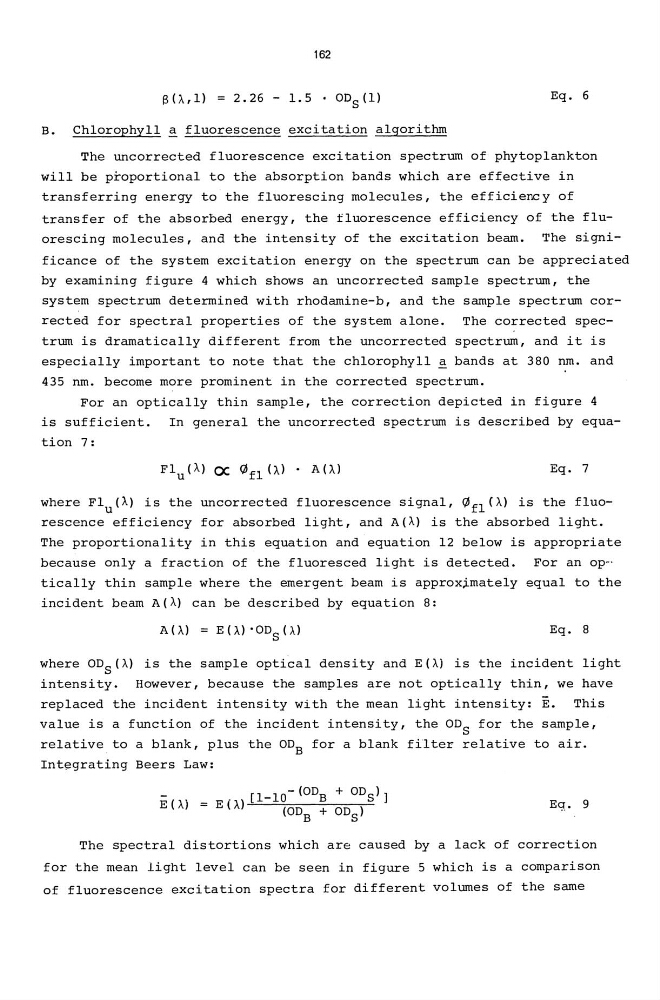
E(Aj
Eg:. 9
The spectral distortions which are caused by a lack of correction
for the mean light level can be seen in figure 5 which is a comparison
of fluorescence excitation spectra for different volumes of the same
130,,1) = 2.26 - 1.5 . ODS(l)
Eq. 6
B. Chlorophyll ~ fluorescence excitation algorithm
The uncorrected fluorescence excitation spectrum of phytoplankton
will be proportional to the absorption bands which are effective in
transferring energy to the fluorescing molecules, the efficiency of
transfer of the absorbed energy, the fluorescence efficiency of the fluorescing molecules, and the intensity of the excitation beam. The significance of the system excitation energy on the spectrum can be appreciated
by examining figure 4 which shows an uncorrected sample spectrum, the
system spectrum determined with rhodamine-b, and the sample spectrum corrected for spectral properties of the system alone.
The corrected spectrum is dramatically different from the uncorrected spectrum, and it is
especially important to note that the chlorophyll ~ bands at 380 nrn. and
435 nm. become more prominent in the corrected spectrum.
For an optically thin sample, the correction depicted in figure 4
is sufficient.
In general the uncorrected spectrum is described by equation 7:
Flu (A) ex !Pfl (A) . A (A)
Eq. 7
where Flu(A) is the uncorrected fluorescence signal, !Pfl(A) is the fluorescence efficiency for absorbed light, and A(A) is the absorbed light.
The proportionality in this equation and equation 12 below is appropriate
because only a fraction of the fluoresced light is detected.
For an op-'
tically thin sample where the emergent beam is approx~mately equal to the
incident beam A(A) can be described by equation 8:
A(A) = E(A) 'ODS(A)
Eq. 8
where ODS (A) is the sample optical density and E(Aj is the incident light
intensity.
However, because the samples are not optically thin, we have
replaced the incident intensity with the mean light intensity: E.
This
value is a function of the incident intensity, the ODS for the sample,
relative to a blank, plus the OD B for a blank filter relative to air.
Integrating Beers Law:
E(Aj
Eg:. 9
The spectral distortions which are caused by a lack of correction
for the mean light level can be seen in figure 5 which is a comparison
of fluorescence excitation spectra for different volumes of the same