

163
2.0
0.8
3.0
:'ID
0;;1 3
i5 01.4
09 N
1.2
-.- •. -.!..
0.4
. . c:s 1-...
u
.~ .
a
u.
2.0
. ..
t!1
.,a
".. ,:-..
0;1
!t.
u
c:s
f
u.
• ""y~.
d
t!1
. "'
c:s
0.0
a to
0.0
0.2
0.4
0.0
0.2
0.4
0.0. BSA
O.D. BSA
ln~~--~--~~-'
Q.O
().2
Q.4
Q6
as
00(1)
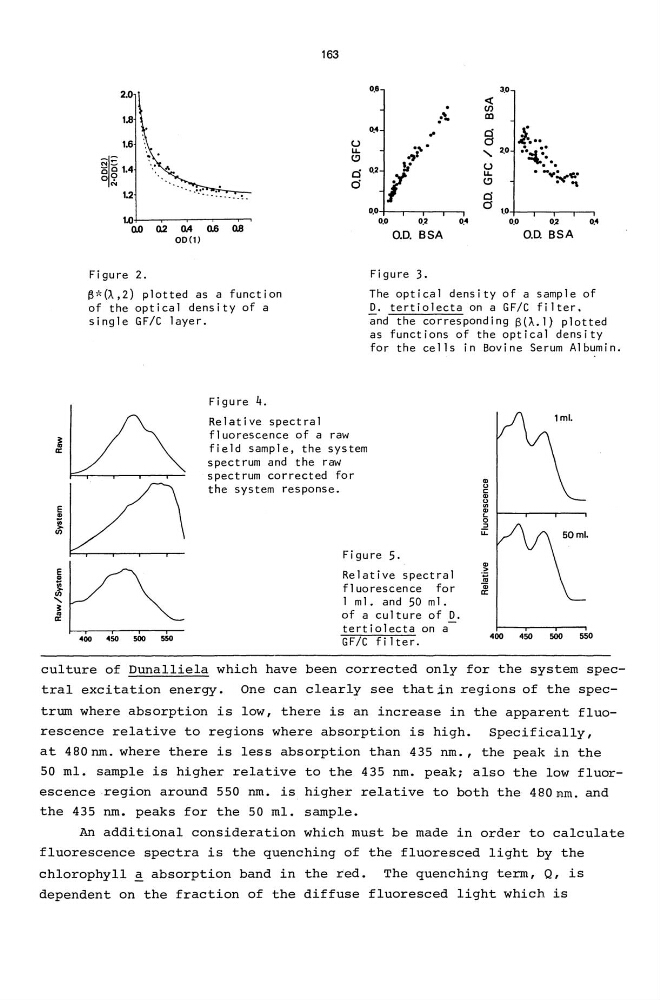
Figure 2.
Figure 3.
B*(A,2) plotted as a function
of the optical density of a
single GF/C layer.
The optical density of a sample of
400
450
500
550
D. tertiolecta on a GF/C filter.
and the corresponding S(A.I} plotted
as functions of the optical density
for the cells in Bovine Serum Albumin.
Figure 4.
Relative spectral
fluorescence of a raw
field sample, the system
spectrum and the raw
spectrum corrected for
the system response.
Figure 5.
Relative spectral
fluorescence for
I mI. and 50 mI.
of a culture of D.
tertiolecta on a
GF/C fi Iter.
400
450
500
550
culture of Dunalliela which have been corrected only for the system spectral excitation energy. One can clearly see thatin regions of the spectrum where absorption is low, there is an increase in the apparent fluorescence relative to regions where absorption is high. Specifically,
at 480nm. where there is less absorption than 435 nm., the peak in the
50 mI. sample is higher relative to the 435 nm. peak; also the low fluorescence region around 550 nm. is higher relative to both the 480nm. and
the 435 nm. peaks for the 50 mI. sample.
An additional consideration which must be made in order to calculate
fluorescence spectra is the quenching of the fluoresced light by the
chlorophyll!! absorption band in the red. The quenching term, Q, is
dependent on the fraction of the diffuse fluoresced light which is
2.0
0.8
3.0
:'ID
0;;1 3
i5 01.4
09 N
1.2
-.- •. -.!..
0.4
. . c:s 1-...
u
.~ .
a
u.
2.0
. ..
t!1
.,a
".. ,:-..
0;1
!t.
u
c:s
f
u.
• ""y~.
d
t!1
. "'
c:s
0.0
a to
0.0
0.2
0.4
0.0
0.2
0.4
0.0. BSA
O.D. BSA
ln~~--~--~~-'
Q.O
().2
Q.4
Q6
as
00(1)
Figure 2.
Figure 3.
B*(A,2) plotted as a function
of the optical density of a
single GF/C layer.
The optical density of a sample of
400
450
500
550
D. tertiolecta on a GF/C filter.
and the corresponding S(A.I} plotted
as functions of the optical density
for the cells in Bovine Serum Albumin.
Figure 4.
Relative spectral
fluorescence of a raw
field sample, the system
spectrum and the raw
spectrum corrected for
the system response.
Figure 5.
Relative spectral
fluorescence for
I mI. and 50 mI.
of a culture of D.
tertiolecta on a
GF/C fi Iter.
400
450
500
550
culture of Dunalliela which have been corrected only for the system spectral excitation energy. One can clearly see thatin regions of the spectrum where absorption is low, there is an increase in the apparent fluorescence relative to regions where absorption is high. Specifically,
at 480nm. where there is less absorption than 435 nm., the peak in the
50 mI. sample is higher relative to the 435 nm. peak; also the low fluorescence region around 550 nm. is higher relative to both the 480nm. and
the 435 nm. peaks for the 50 mI. sample.
An additional consideration which must be made in order to calculate
fluorescence spectra is the quenching of the fluoresced light by the
chlorophyll!! absorption band in the red. The quenching term, Q, is
dependent on the fraction of the diffuse fluoresced light which is