

152
Numbers of cells at each map location can be integrated by the
flow cytometer yielding relative numbers.
To obtain actual concentrations per ml, we must add standard beads at known concentrations
or do direct counts.
If we increase the gains or laser power, the
signal moves away from the origin.
Once these settings are established, they cannot be altered if intercomparison of data is desired.
There are many possible alternative choices, such as red fluorescence vs. forward angle light scatter, etc. At the moment, forward
angle light scatter is problematic in that it is measured by a
photodiode and is limited to a linear vs. three-decade log scale.
Installation of a log amplifier should remedy this current shortcoming. Biomedical researchers have, for the most part, worked with
cells with very similar light scatter; they have not had to deal with
the diversity of size and shape which challenges biological oceanographers.
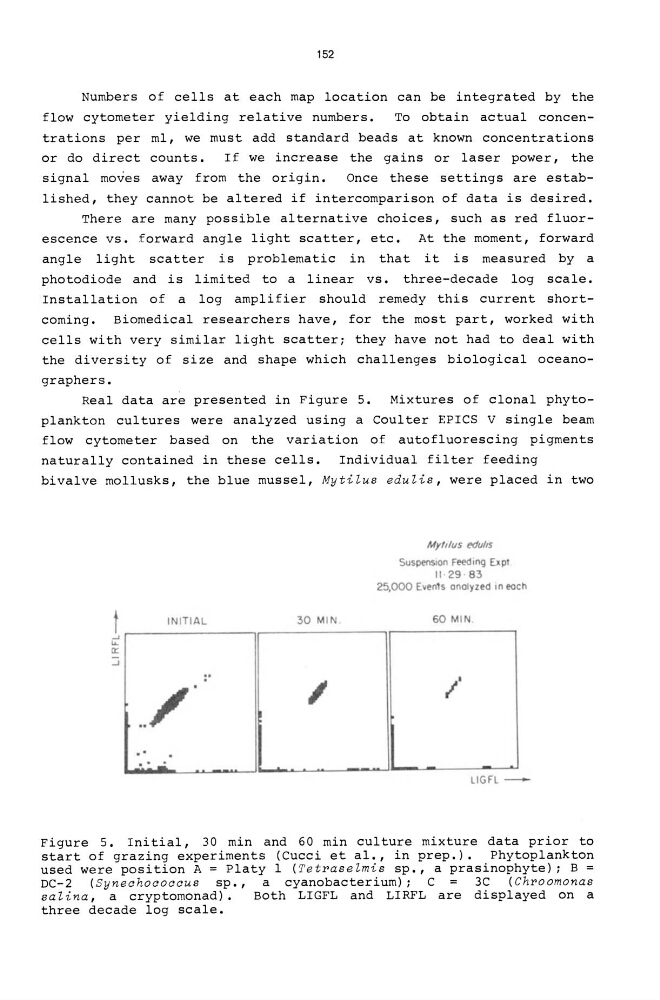
Real data are presented in Figure 5.
Mixtures of clonal phytoplankton cultures were analyzed using a Coulter EPICS V single beam
flow cytometer based on the variation of autofluorescing pigments
naturally contained in these cells.
Individual filter feeding
bivalve mollusks, the blue mussel, Mytilus e d ulis, were placed in two
t
--'
"II:
:J
IN ITIA L
00/'
. .
0
o •
30 MI
I
MyftluS Mulls
SuspensIon Feed In9 Ex pI
11· 29 · 83
25,000 E.en1s analyzed In each
60 MI N.
/
LlGFL -
Figure 5. Initial, 30 min and 60 min culture mixture data prior to
start of grazing experiments (Cucci et al., in prep.). Phytoplankton
used were position A = Platy 1 ( Te t~aselm i s sp., a prasinophyte); B =
DC-2 (Sy n e chococcus sp., a cyanobacterium); C
3C (Chroomonas
salina, a cryptomonad).
Both LIGFL and LIRFL are displayed on a
three decade log scale.
Numbers of cells at each map location can be integrated by the
flow cytometer yielding relative numbers.
To obtain actual concentrations per ml, we must add standard beads at known concentrations
or do direct counts.
If we increase the gains or laser power, the
signal moves away from the origin.
Once these settings are established, they cannot be altered if intercomparison of data is desired.
There are many possible alternative choices, such as red fluorescence vs. forward angle light scatter, etc. At the moment, forward
angle light scatter is problematic in that it is measured by a
photodiode and is limited to a linear vs. three-decade log scale.
Installation of a log amplifier should remedy this current shortcoming. Biomedical researchers have, for the most part, worked with
cells with very similar light scatter; they have not had to deal with
the diversity of size and shape which challenges biological oceanographers.
Real data are presented in Figure 5.
Mixtures of clonal phytoplankton cultures were analyzed using a Coulter EPICS V single beam
flow cytometer based on the variation of autofluorescing pigments
naturally contained in these cells.
Individual filter feeding
bivalve mollusks, the blue mussel, Mytilus e d ulis, were placed in two
t
--'
"II:
:J
IN ITIA L
00/'
. .
0
o •
30 MI
I
MyftluS Mulls
SuspensIon Feed In9 Ex pI
11· 29 · 83
25,000 E.en1s analyzed In each
60 MI N.
/
LlGFL -
Figure 5. Initial, 30 min and 60 min culture mixture data prior to
start of grazing experiments (Cucci et al., in prep.). Phytoplankton
used were position A = Platy 1 ( Te t~aselm i s sp., a prasinophyte); B =
DC-2 (Sy n e chococcus sp., a cyanobacterium); C
3C (Chroomonas
salina, a cryptomonad).
Both LIGFL and LIRFL are displayed on a
three decade log scale.