

153
liter beakers containing these cell suspensions and the suspensions
monitored with time.
In addition, feces were collected after 2 hand
gently sonified until dissociated and then analyzed.
Data analysis
of bivariate contour plots of the fluorescence signals permits
assessment of filtration rates, ingestion rates, utilization and
assimilation rates (Cucci et al., in prep.).
C. Automated characterization of natural populations:
Natural populations acquired by pumping water from subsurface
particle maxima (maxima identified by transmissometry or in vivo
chlorophyll fluorometry) can be analyzed either as a raw water sample
or by concentrating larger particles between Nitex netting. For the
data presented here, organisms were concentrated between 20-55 IJm
Nitex netting as pumped from a subsurface maximum at a station near
Monhegan Island (43 0 15'N 69 0 15'W) into nets submerged in a water bath
to reduce friction on the cells.
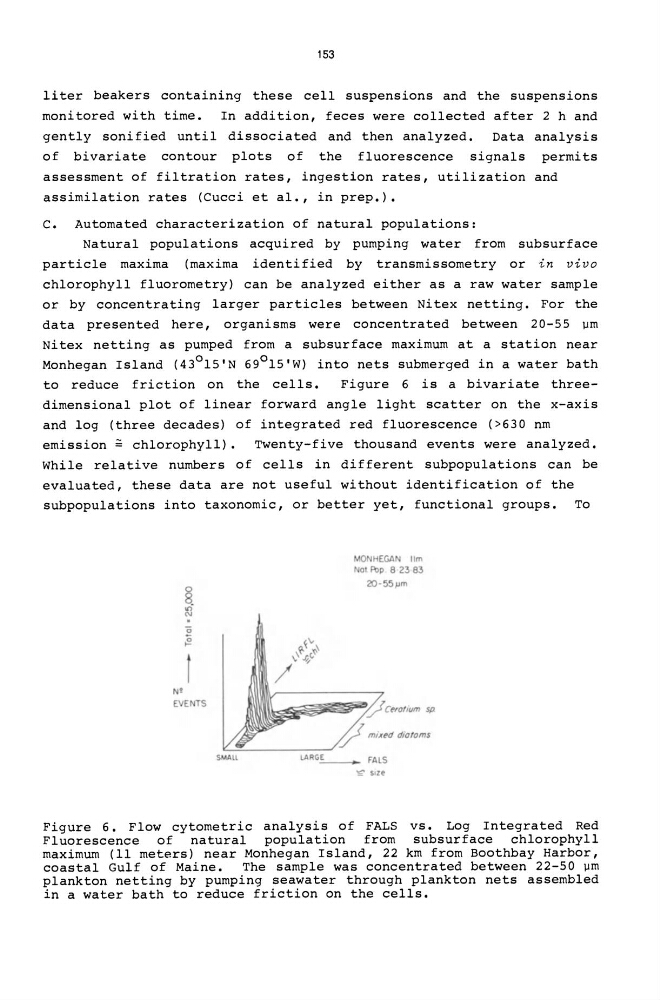
Figure 6 is a bivariate threedimensional plot of linear forward angle light scatter on the x-axis
and log (three decades) of integrated red fluorescence (>630 nm
emission ~ chlorophyll).
Twenty-five thousand events were analyzed.
While relative numbers of cells in different subpopulations can be
evaluated, these data are not useful without identification of the
subpopulations into taxonomic, or better yet, functional groups. To
a on
'"
N!
EVENTS
MONHEGAN 11m
Not Rlp 8 23 83
2Q - 55/Jm
Figure 6. Flow cytometric analysis of FALS vs. Log Integrated Red
Fluorescence of natural population from subsurface chlorophyll
maximum (11 meters) near Monhegan Island, 22 km from Boothbay Harbor,
coastal Gulf of Maine.
The sample was concentrated between 22-50 IJm
plankton netting by pumping seawater through plankton nets assembled
in a water bath to reduce friction on the cells.
liter beakers containing these cell suspensions and the suspensions
monitored with time.
In addition, feces were collected after 2 hand
gently sonified until dissociated and then analyzed.
Data analysis
of bivariate contour plots of the fluorescence signals permits
assessment of filtration rates, ingestion rates, utilization and
assimilation rates (Cucci et al., in prep.).
C. Automated characterization of natural populations:
Natural populations acquired by pumping water from subsurface
particle maxima (maxima identified by transmissometry or in vivo
chlorophyll fluorometry) can be analyzed either as a raw water sample
or by concentrating larger particles between Nitex netting. For the
data presented here, organisms were concentrated between 20-55 IJm
Nitex netting as pumped from a subsurface maximum at a station near
Monhegan Island (43 0 15'N 69 0 15'W) into nets submerged in a water bath
to reduce friction on the cells.
Figure 6 is a bivariate threedimensional plot of linear forward angle light scatter on the x-axis
and log (three decades) of integrated red fluorescence (>630 nm
emission ~ chlorophyll).
Twenty-five thousand events were analyzed.
While relative numbers of cells in different subpopulations can be
evaluated, these data are not useful without identification of the
subpopulations into taxonomic, or better yet, functional groups. To
a on
'"
N!
EVENTS
MONHEGAN 11m
Not Rlp 8 23 83
2Q - 55/Jm
Figure 6. Flow cytometric analysis of FALS vs. Log Integrated Red
Fluorescence of natural population from subsurface chlorophyll
maximum (11 meters) near Monhegan Island, 22 km from Boothbay Harbor,
coastal Gulf of Maine.
The sample was concentrated between 22-50 IJm
plankton netting by pumping seawater through plankton nets assembled
in a water bath to reduce friction on the cells.