

734
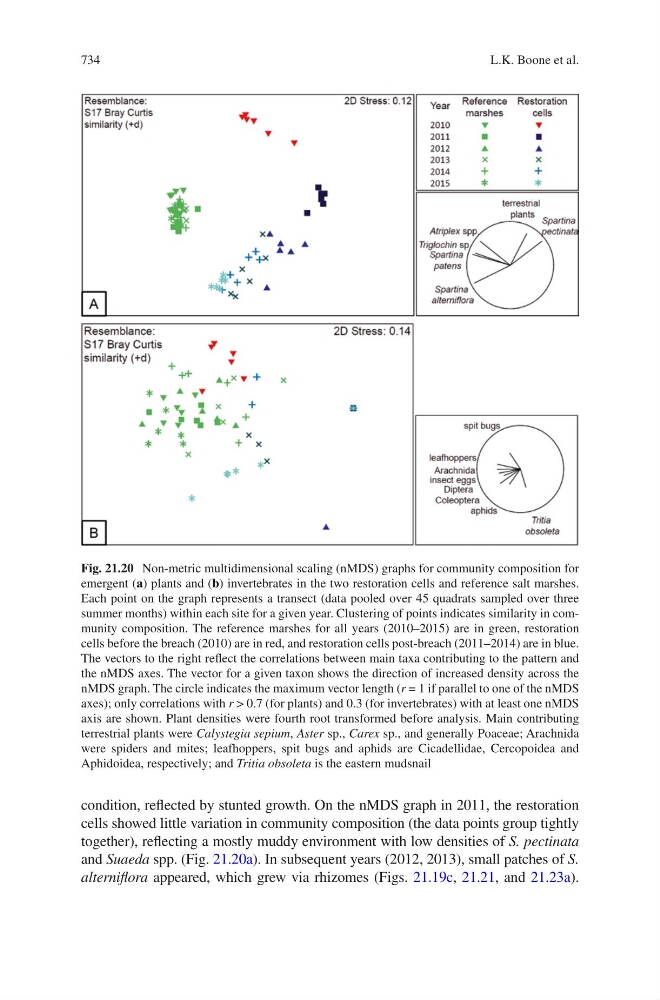
condition, reflected by stunted growth. On the nMDS graph in 2011, the restoration
cells showed little variation in community composition (the data points group tightly
together), reflecting a mostly muddy environment with low densities of S. pectinata
and Suaeda spp. (Fig. 21.20a). In subsequent years (2012, 2013), small patches of S.
alterniflora appeared, which grew via rhizomes (Figs. 21.19c, 21.21, and 21.23a).
Fig. 21.20 Non-metric multidimensional scaling (nMDS) graphs for community composition for
emergent (a) plants and (b) invertebrates in the two restoration cells and reference salt marshes.
Each point on the graph represents a transect (data pooled over 45 quadrats sampled over three
summer months) within each site for a given year. Clustering of points indicates similarity in community composition. The reference marshes for all years (2010–2015) are in green, restoration
cells before the breach (2010) are in red, and restoration cells post-breach (2011–2014) are in blue.
The vectors to the right reflect the correlations between main taxa contributing to the pattern and
the nMDS axes. The vector for a given taxon shows the direction of increased density across the
nMDS graph. The circle indicates the maximum vector length (r = 1 if parallel to one of the nMDS
axes); only correlations with r > 0.7 (for plants) and 0.3 (for invertebrates) with at least one nMDS
axis are shown. Plant densities were fourth root transformed before analysis. Main contributing
terrestrial plants were Calystegia sepium, Aster sp., Carex sp., and generally Poaceae; Arachnida
were spiders and mites; leafhoppers, spit bugs and aphids are Cicadellidae, Cercopoidea and
Aphidoidea, respectively; and Tritia obsoleta is the eastern mudsnail
L.K. Boone et al.