

720
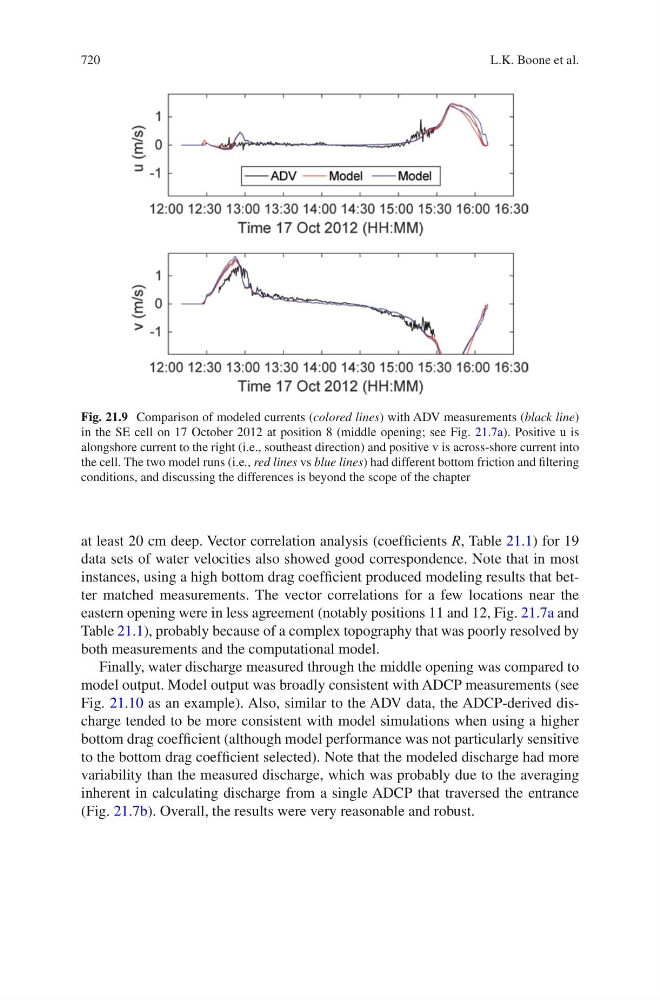
Fig. 21.9 Comparison of modeled currents (colored lines) with ADV measurements (black line)
in the SE cell on 17 October 2012 at position 8 (middle opening; see Fig. 21.7a). Positive u is
alongshore current to the right (i.e., southeast direction) and positive v is across-shore current into
the cell. The two model runs (i.e., red lines vs blue lines) had different bottom friction and filtering
conditions, and discussing the differences is beyond the scope of the chapter
at least 20 cm deep. Vector correlation analysis (coefficients R, Table 21.1) for 19
data sets of water velocities also showed good correspondence. Note that in most
instances, using a high bottom drag coefficient produced modeling results that better matched measurements. The vector correlations for a few locations near the
eastern opening were in less agreement (notably positions 11 and 12, Fig. 21.7a and
Table 21.1), probably because of a complex topography that was poorly resolved by
both measurements and the computational model.
Finally, water discharge measured through the middle opening was compared to
model output. Model output was broadly consistent with ADCP measurements (see
Fig. 21.10 as an example). Also, similar to the ADV data, the ADCP-derived discharge tended to be more consistent with model simulations when using a higher
bottom drag coefficient (although model performance was not particularly sensitive
to the bottom drag coefficient selected). Note that the modeled discharge had more
variability than the measured discharge, which was probably due to the averaging
inherent in calculating discharge from a single ADCP that traversed the entrance
(Fig. 21.7b). Overall, the results were very reasonable and robust.
L.K. Boone et al.