

719
topography, a slightly modified version of the two-dimensional wetting-drying
model used to design the breaches was rerun for tide cycles for which flow data
were recorded using an Acoustic Doppler Velocimeter (ADV) and/or Acoustic
Doppler Current Profiler (ADCP) (Fig. 21.7a). The ADCP was pulled across the
middle breach using a cable (Fig. 21.7b). The ADV was mounted in various locations in the SE cell (Fig. 21.7a) on a post driven into the ground.
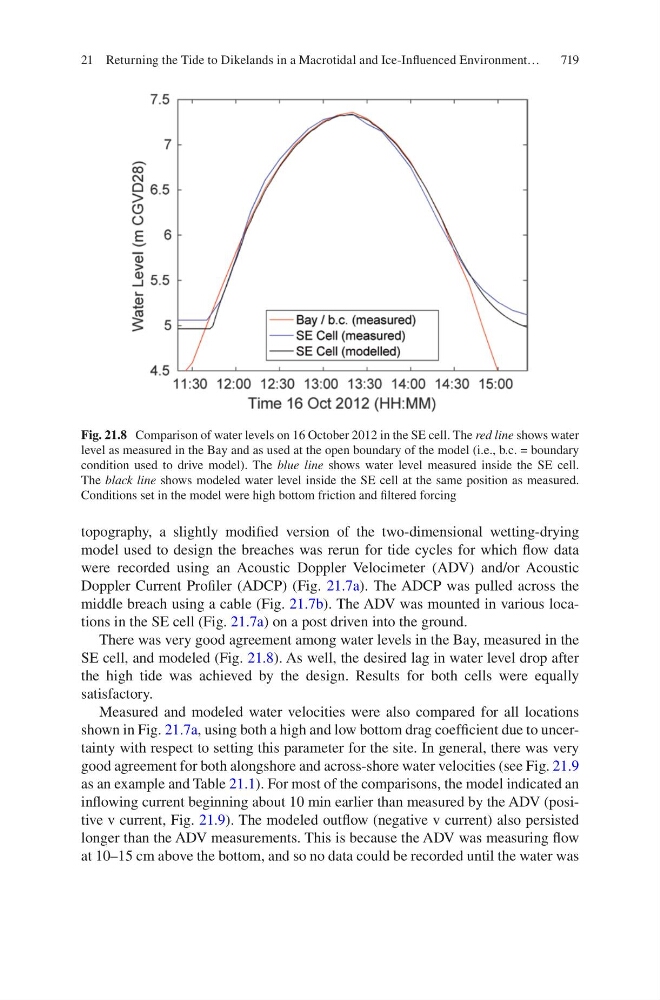
There was very good agreement among water levels in the Bay, measured in the
SE cell, and modeled (Fig. 21.8). As well, the desired lag in water level drop after
the high tide was achieved by the design. Results for both cells were equally
satisfactory.
Measured and modeled water velocities were also compared for all locations
shown in Fig. 21.7a, using both a high and low bottom drag coefficient due to uncertainty with respect to setting this parameter for the site. In general, there was very
good agreement for both alongshore and across-shore water velocities (see Fig. 21.9
as an example and Table 21.1). For most of the comparisons, the model indicated an
inflowing current beginning about 10 min earlier than measured by the ADV (positive v current, Fig. 21.9). The modeled outflow (negative v current) also persisted
longer than the ADV measurements. This is because the ADV was measuring flow
at 10–15 cm above the bottom, and so no data could be recorded until the water was
Fig. 21.8 Comparison of water levels on 16 October 2012 in the SE cell. The red line shows water
level as measured in the Bay and as used at the open boundary of the model (i.e., b.c. = boundary
condition used to drive model). The blue line shows water level measured inside the SE cell.
The black line shows modeled water level inside the SE cell at the same position as measured.
Conditions set in the model were high bottom friction and filtered forcing
21 Returning the Tide to Dikelands in a Macrotidal and Ice-Influenced Environment…