

718
Qualitative and quantitative observations made post-construction of the dike
openings suggested that the final approved design was functioning as planned. The
restoration cells were fully filling with sea water and draining slowly, giving sediment time to deposit. By the end of the first year, substantial sediment had been
deposited in both cells and there was no obvious erosion of the openings; these
results will be discussed more fully in a subsequent section. Of interest here is
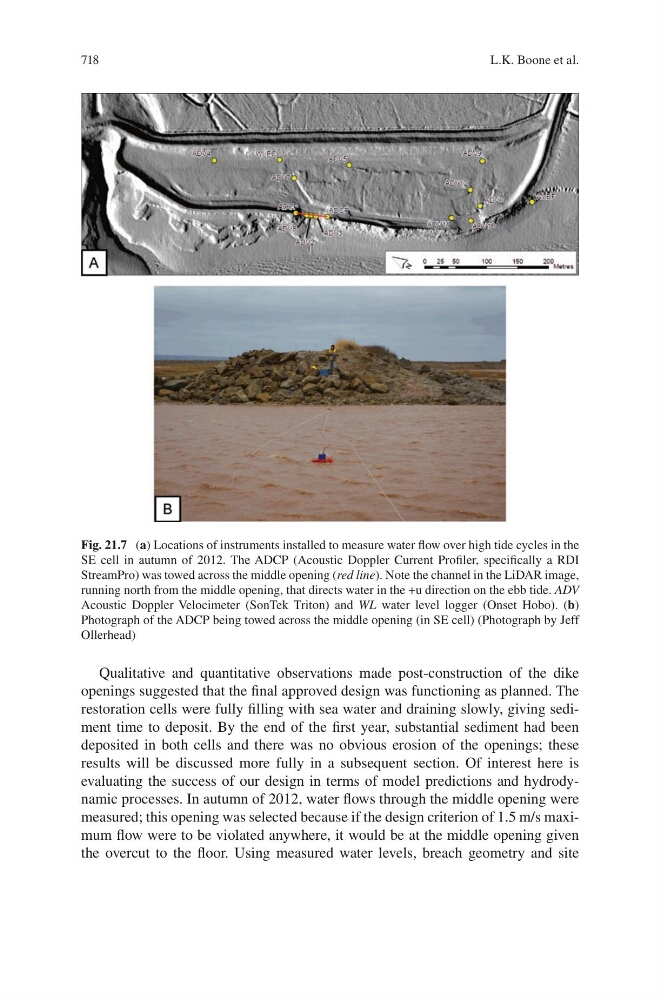
evaluating the success of our design in terms of model predictions and hydrodynamic processes. In autumn of 2012, water flows through the middle opening were
measured; this opening was selected because if the design criterion of 1.5 m/s maximum flow were to be violated anywhere, it would be at the middle opening given
the overcut to the floor. Using measured water levels, breach geometry and site
Fig. 21.7 (a) Locations of instruments installed to measure water flow over high tide cycles in the
SE cell in autumn of 2012. The ADCP (Acoustic Doppler Current Profiler, specifically a RDI
StreamPro) was towed across the middle opening (red line). Note the channel in the LiDAR image,
running north from the middle opening, that directs water in the +u direction on the ebb tide. ADV
Acoustic Doppler Velocimeter (SonTek Triton) and WL water level logger (Onset Hobo). (b)
Photograph of the ADCP being towed across the middle opening (in SE cell) (Photograph by Jeff
Ollerhead)
L.K. Boone et al.