

716
February 2013, there were many ice blocks in the bay by the sites, including blocks
exceeding 30 m
3
in size (Fig. 21.6b). Areas of the cells close to the openings were
littered with ice blocks and many of the channels were plugged with ice and ice
blocks (Fig. 21.6c, d). The openings themselves were plugged with ice blocks (e.g.,
the middle opening in Fig. 21.6e) and flow into and out of the cells was likely being
restricted by this ice.
The amount of ice in the restoration cells in late February 2013 was impressive,
but varied throughout. In some locations, the cell’s surface could not be seen because
of the amount of ice and snow (e.g., Fig. 21.6f). Most of the ice carried sediment (see
also Macfarlane et al. 2011; van Proosdij et al. 2006b). Any ice blocks that melted
within the cells likely deposited sediment. At some higher-elevation locations in the
cells, the contribution of sediment from ice blocks to the overall sediment budget
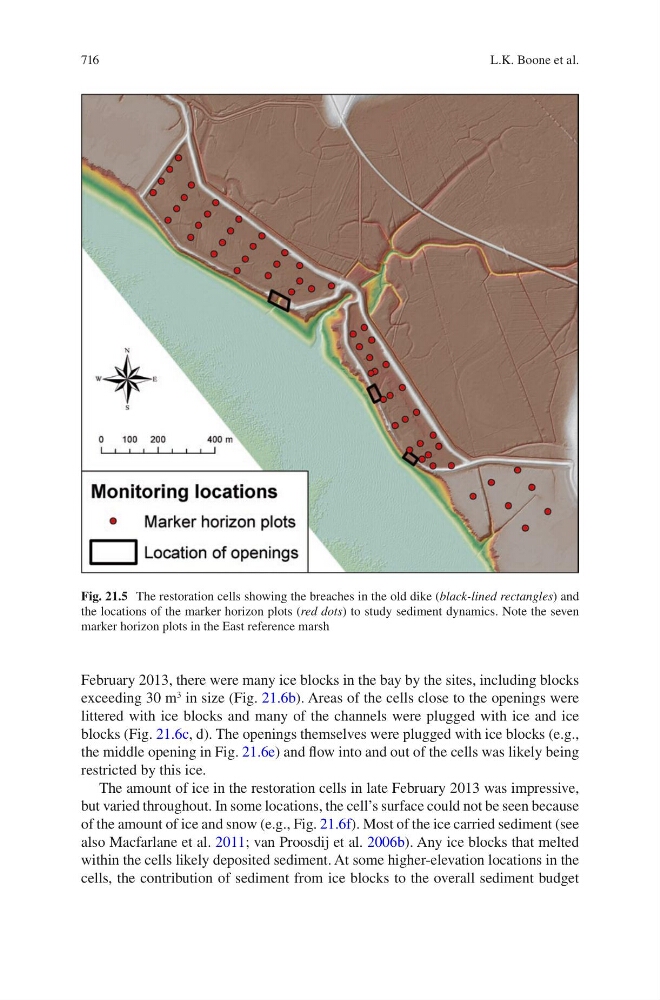
Fig. 21.5 The restoration cells showing the breaches in the old dike (black-lined rectangles) and
the locations of the marker horizon plots (red dots) to study sediment dynamics. Note the seven
marker horizon plots in the East reference marsh
L.K. Boone et al.