

715
that resulted in predicted flows on the flood tide of 2.5 m/s was discarded. Discussing
the modeling in detail is beyond the scope of this chapter, but the following was
considered: (i) flow velocities through the hypothetical openings and in the restoration cells, (ii) likely patterns of sediment deposition, and (iii) possible wave impact
on the new dike. The ideal designs were ones that minimized (i) and (iii) and maximized (ii). The final design selected balanced optimal modeled outcomes with construction cost and complexity.
Given that building a sediment platform for a new salt marsh was of paramount
importance, particular attention was paid to sediment deposition (ii). An example of
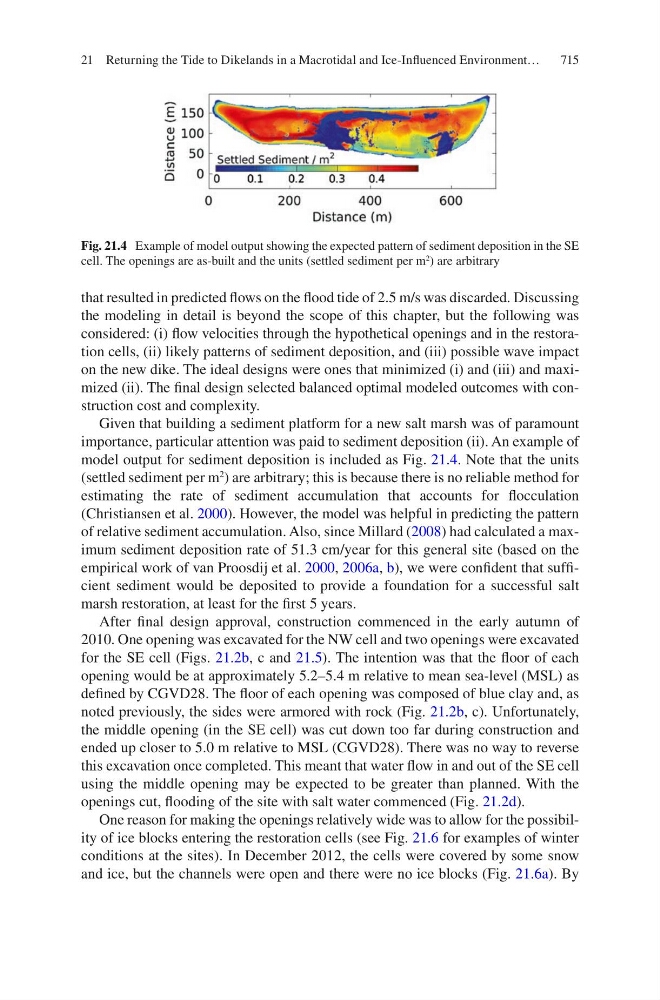
model output for sediment deposition is included as Fig. 21.4. Note that the units
(settled sediment per m
2
) are arbitrary; this is because there is no reliable method for
estimating the rate of sediment accumulation that accounts for flocculation
(Christiansen et al. 2000). However, the model was helpful in predicting the pattern
of relative sediment accumulation. Also, since Millard (2008) had calculated a maximum sediment deposition rate of 51.3 cm/year for this general site (based on the
empirical work of van Proosdij et al. 2000, 2006a, b), we were confident that sufficient sediment would be deposited to provide a foundation for a successful salt
marsh restoration, at least for the first 5 years.
After final design approval, construction commenced in the early autumn of
2010. One opening was excavated for the NW cell and two openings were excavated
for the SE cell (Figs. 21.2b, c and 21.5). The intention was that the floor of each
opening would be at approximately 5.2–5.4 m relative to mean sea-level (MSL) as
defined by CGVD28. The floor of each opening was composed of blue clay and, as
noted previously, the sides were armored with rock (Fig. 21.2b, c). Unfortunately,
the middle opening (in the SE cell) was cut down too far during construction and
ended up closer to 5.0 m relative to MSL (CGVD28). There was no way to reverse
this excavation once completed. This meant that water flow in and out of the SE cell
using the middle opening may be expected to be greater than planned. With the
openings cut, flooding of the site with salt water commenced (Fig. 21.2d).
One reason for making the openings relatively wide was to allow for the possibility of ice blocks entering the restoration cells (see Fig. 21.6 for examples of winter
conditions at the sites). In December 2012, the cells were covered by some snow
and ice, but the channels were open and there were no ice blocks (Fig. 21.6a). By
Fig. 21.4 Example of model output showing the expected pattern of sediment deposition in the SE
cell. The openings are as-built and the units (settled sediment per m
2
) are arbitrary
21 Returning the Tide to Dikelands in a Macrotidal and Ice-Influenced Environment…