

621
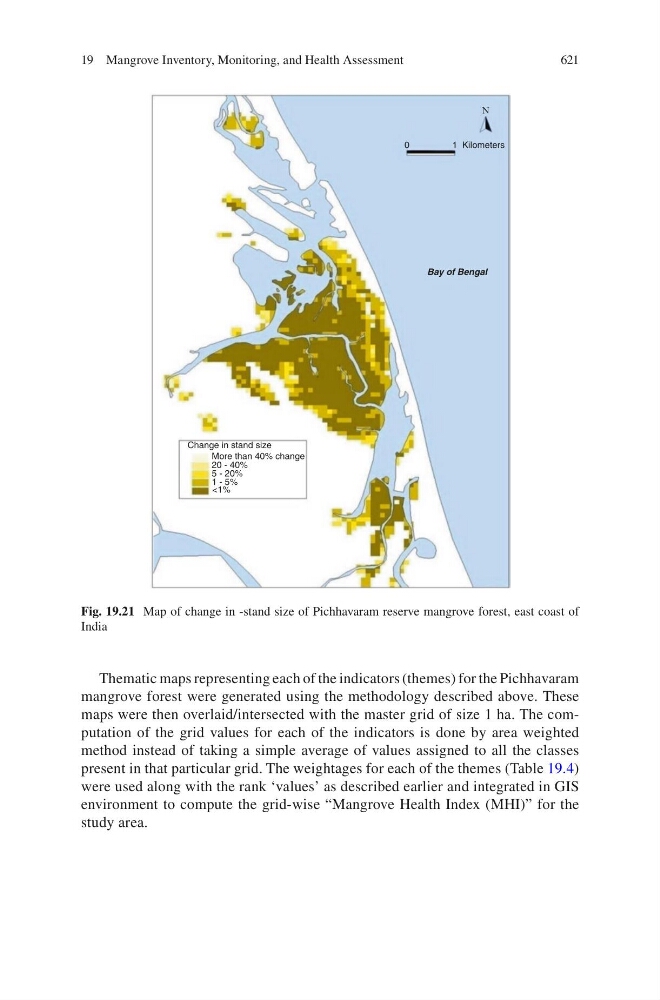
Thematic maps representing each of the indicators (themes) for the Pichhavaram
mangrove forest were generated using the methodology described above. These
maps were then overlaid/intersected with the master grid of size 1 ha. The computation of the grid values for each of the indicators is done by area weighted
method instead of taking a simple average of values assigned to all the classes
present in that particular grid. The weightages for each of the themes (Table 19.4)
were used along with the rank ‘values’ as described earlier and integrated in GIS
environment to compute the grid-wise “Mangrove Health Index (MHI)” for the
study area.
0
1Kilometers
N
Bay of Bengal
Change in stand size
More than 40% change
20 - 40%
5 - 20%
1 - 5%
<1%
Fig. 19.21 Map of change in -stand size of Pichhavaram reserve mangrove forest, east coast of
India
19 Mangrove Inventory, Monitoring, and Health Assessment